In the admin dashboard, the restaurant can keep track of its success by viewing and exporting restaurant reports from the reporting module. That’s where they can also find recommendations on what they can do to get more online orders and sell more.
Dashboard
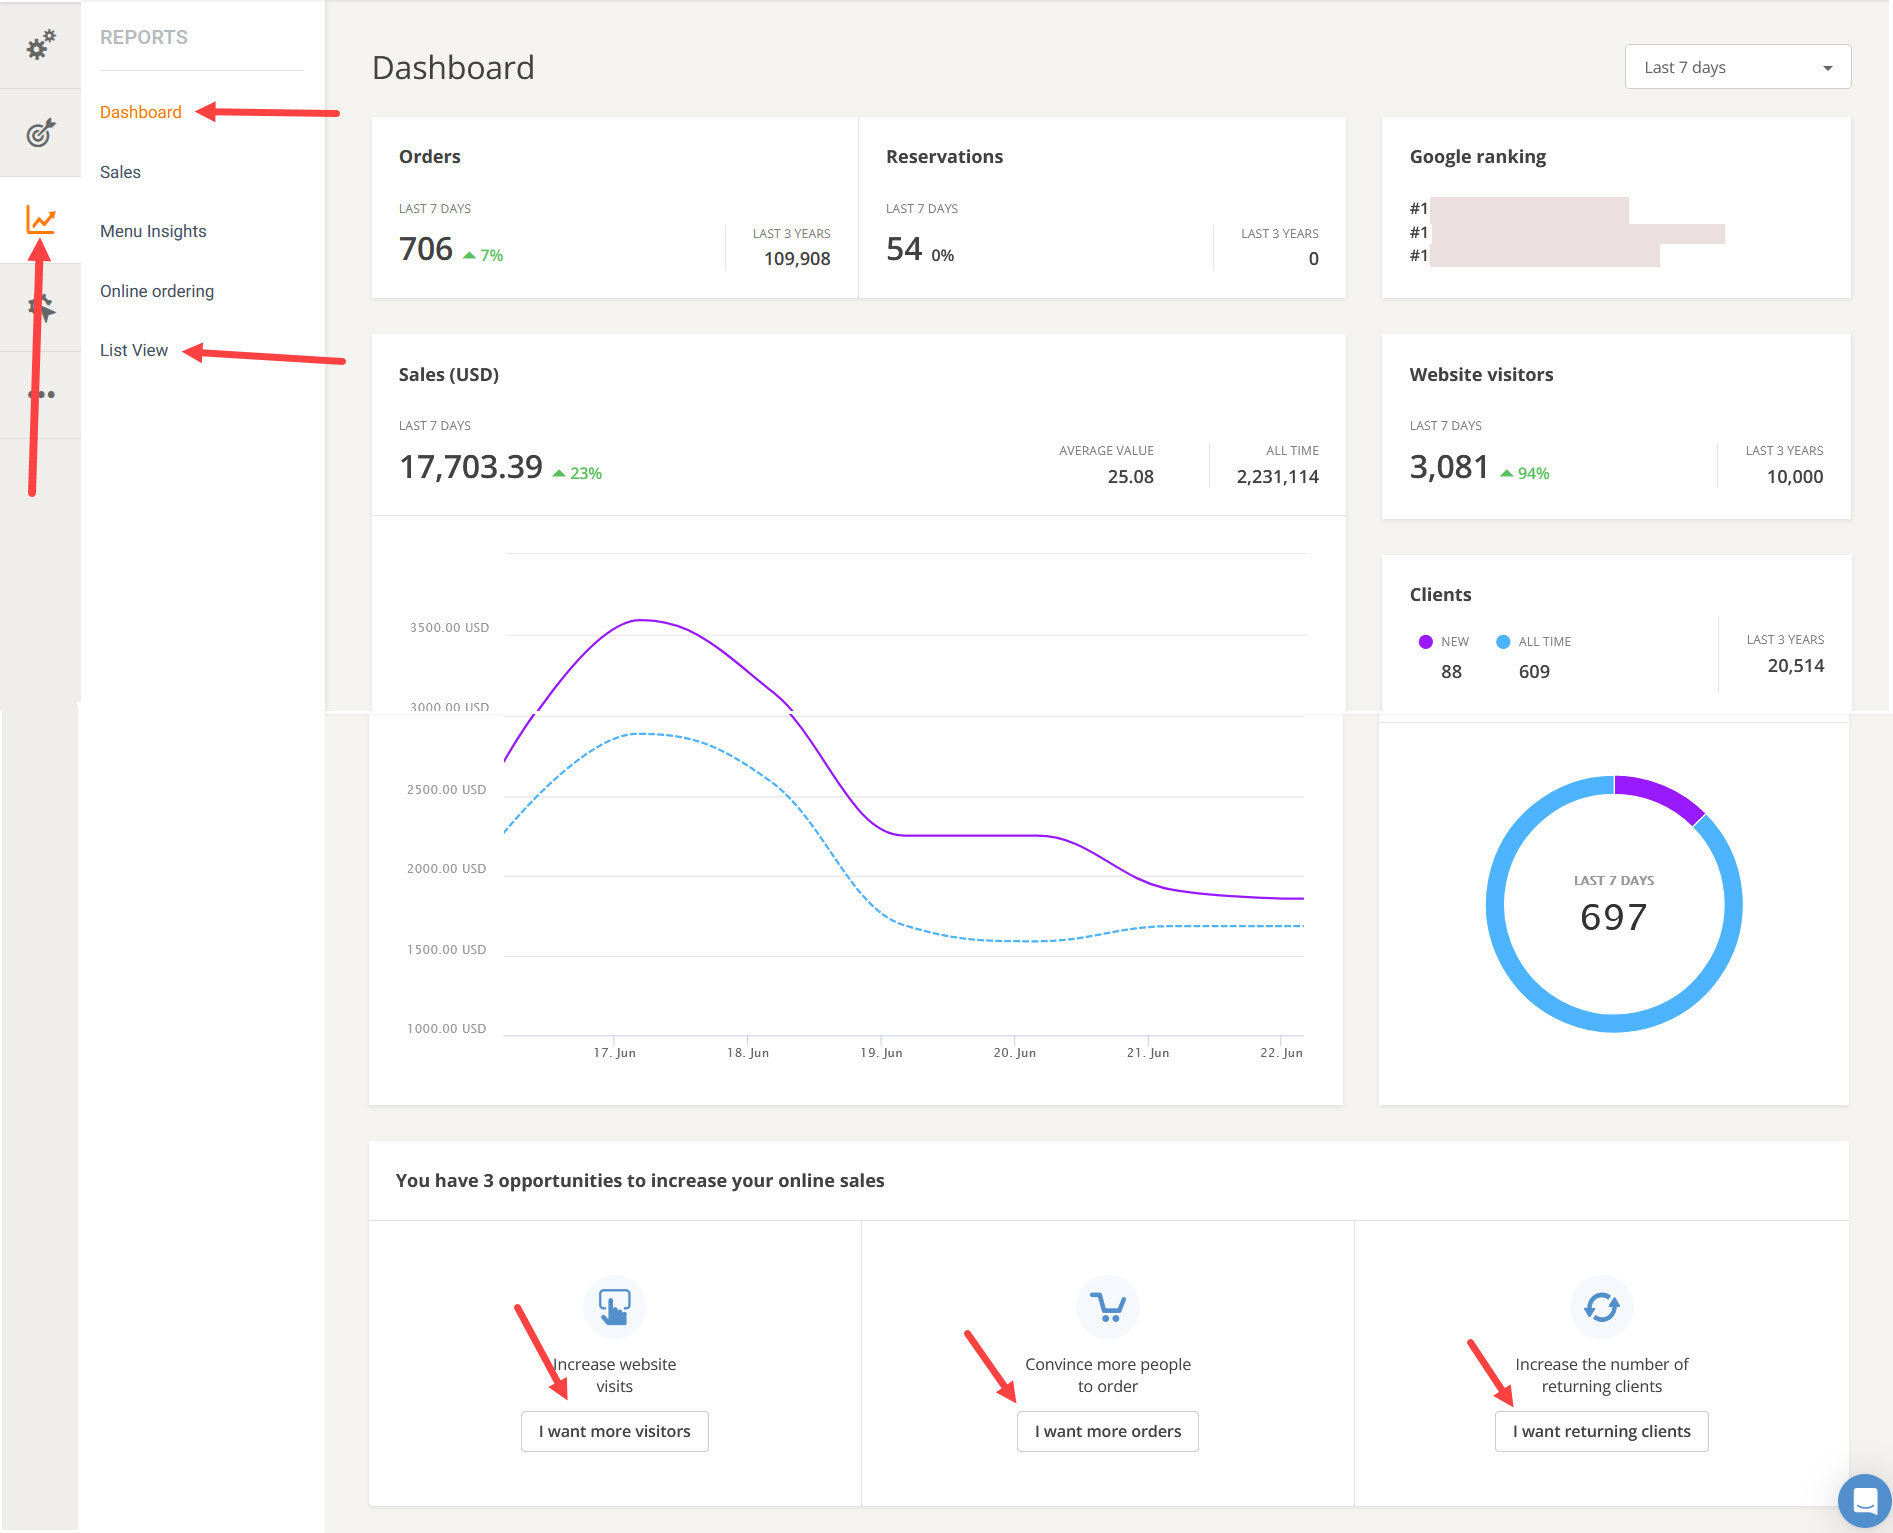
In the “Dashboard” section, the restaurant owner will get the big picture of how the restaurant is doing in terms of the number of orders, table reservations (if the feature is active), sales, Google ranking, website visitors, and number of clients. They can filter the time period for which they want to see the data in the top right corner.
Below the information from the dashboard, some opportunities to increase online sales are highlighted. Click each of them to get some tips on selling more.
It’s good to mention that each of the sections in “Dashboard” is discussed more in detail in the “Sales” and “Online ordering” sections.
Sales
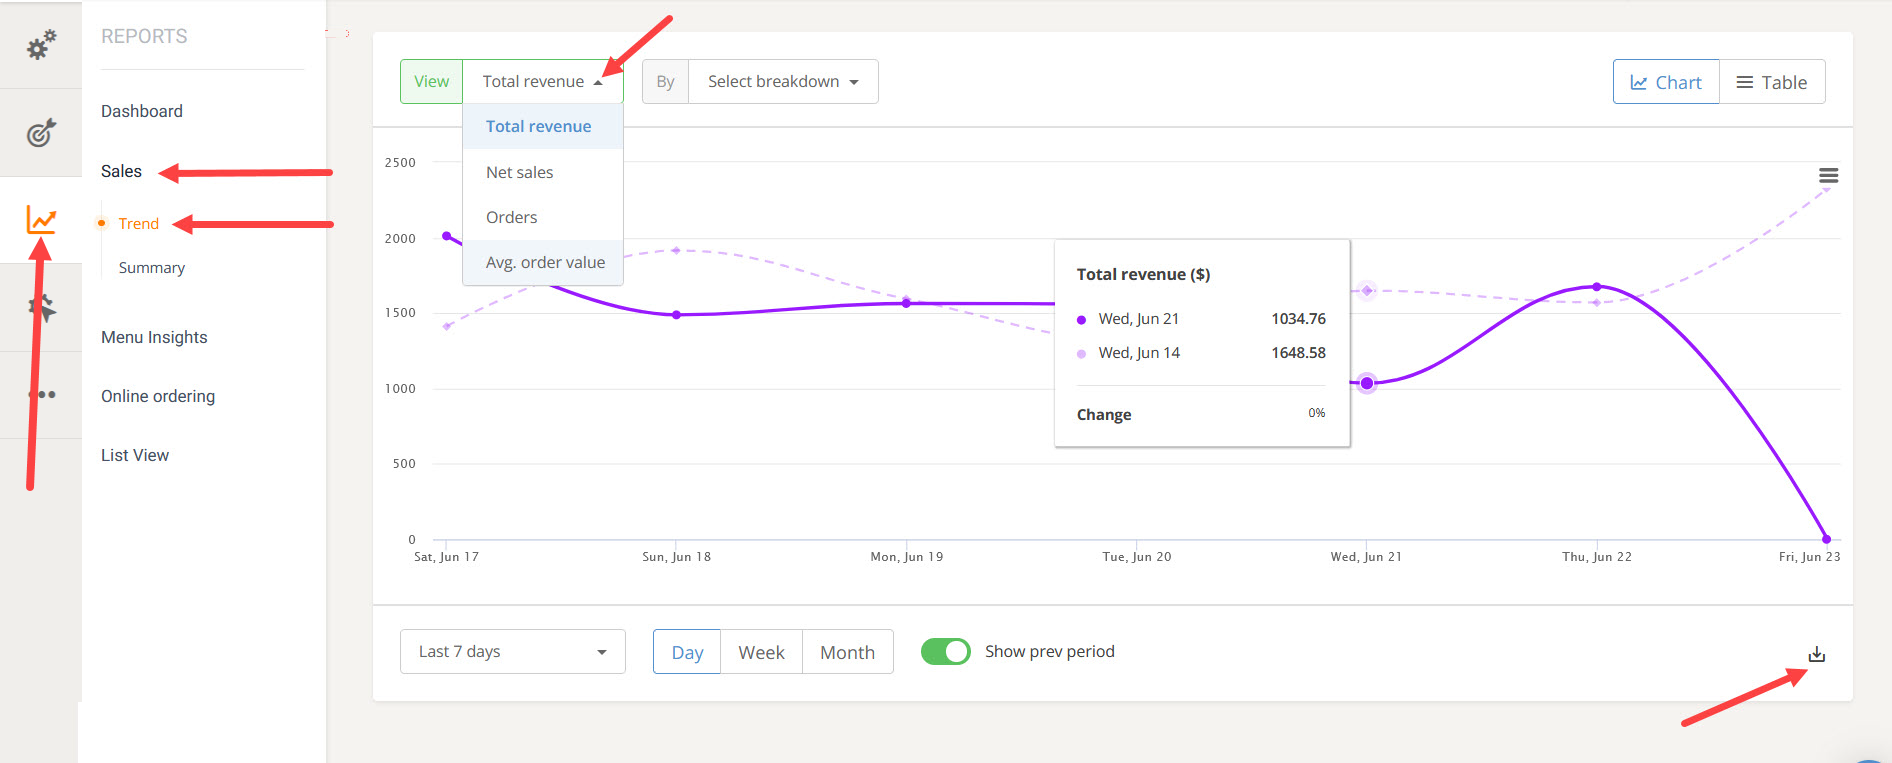
On the page marked “Trend” from the “Sales” section restaurant owners can learn more about their sales and filter them according to total revenue, net sales (=sales not including taxes), orders, avg. order value. There is a breakdown per order type.
In the Summary section restaurant owners are able to assess the order volume and see sales by day, week, month, payment method, order type. They can also choose to see sales from a larger period of time and export them in a PDF, CSV or Excel format.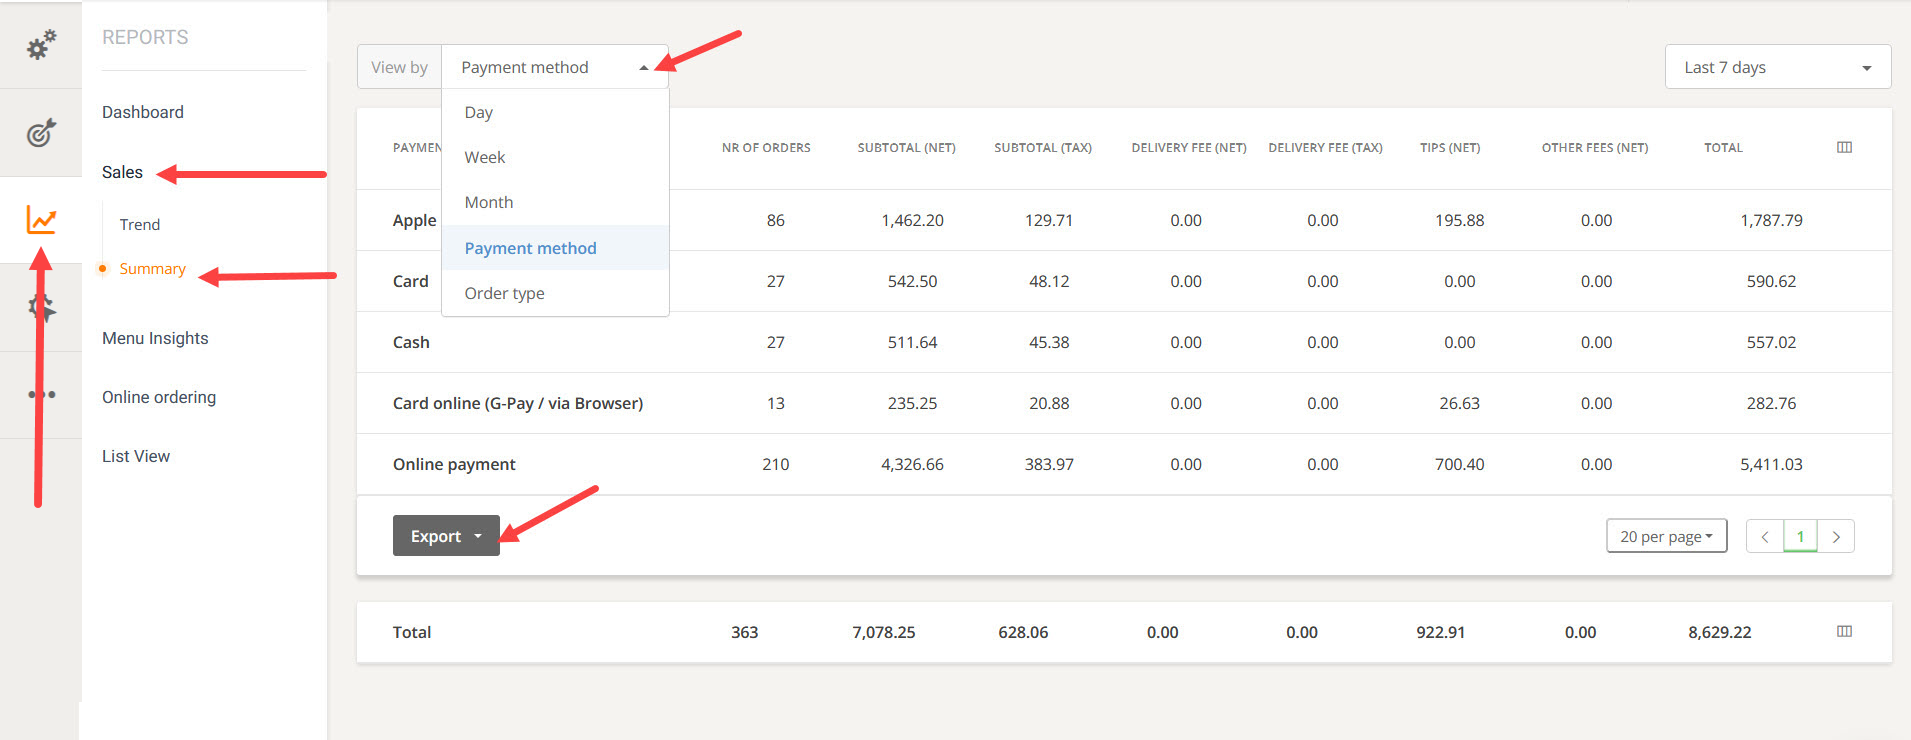
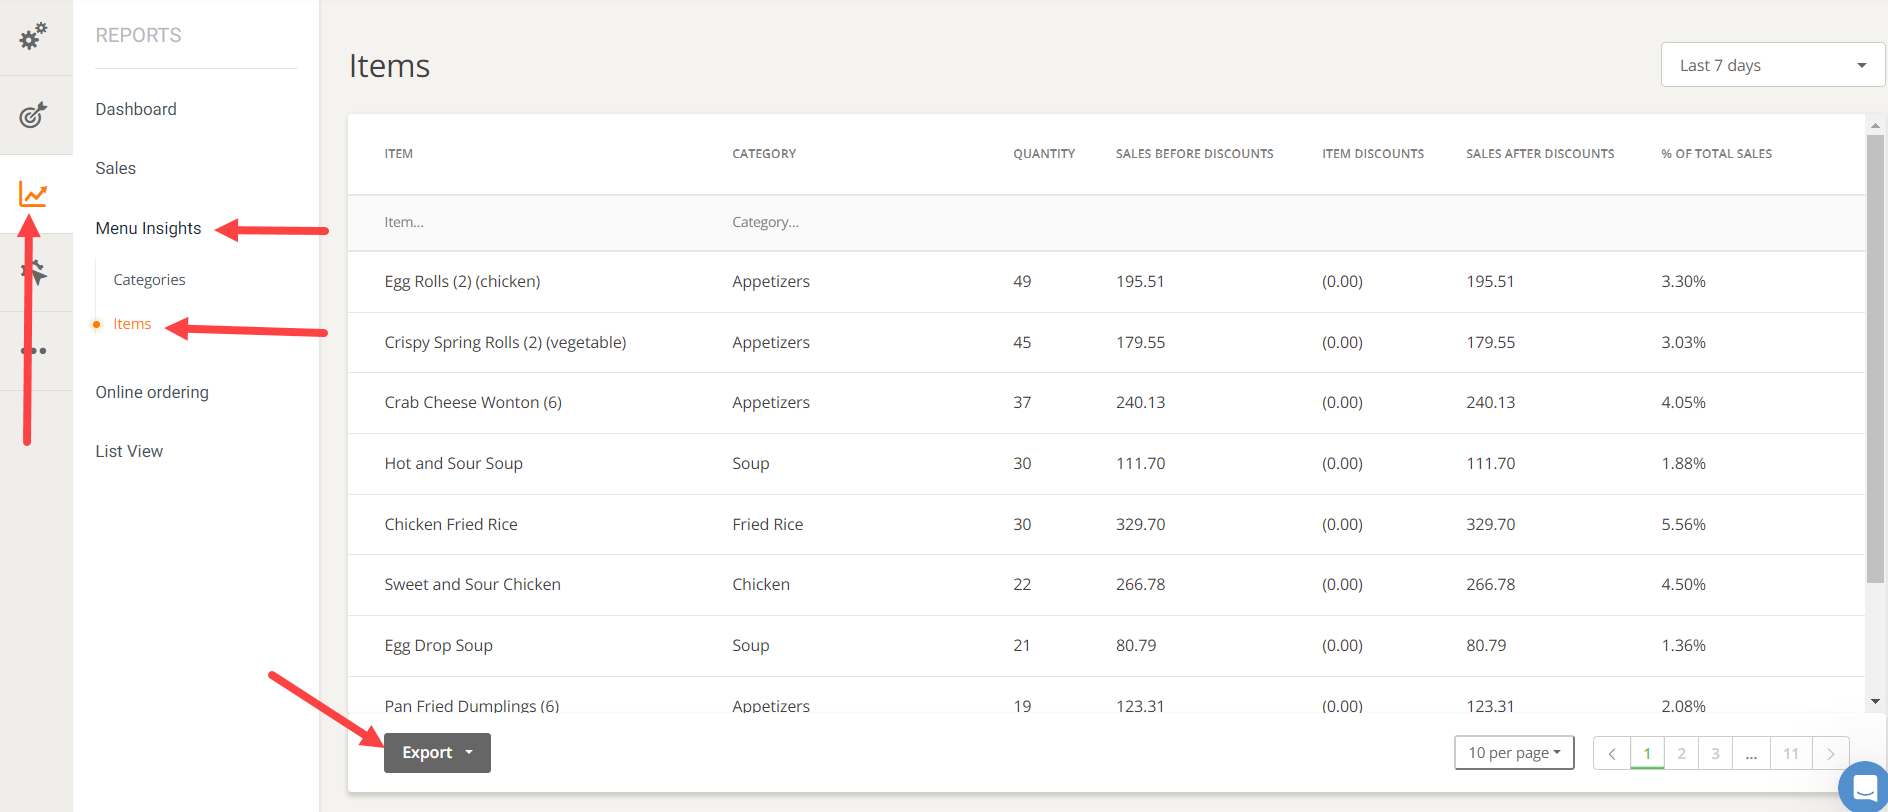
Menu insights
In this section restaurant owners are able to view quantity of sold menu items, the category where they belong, item discounts, % of total sales, sales after discounts per type of item:
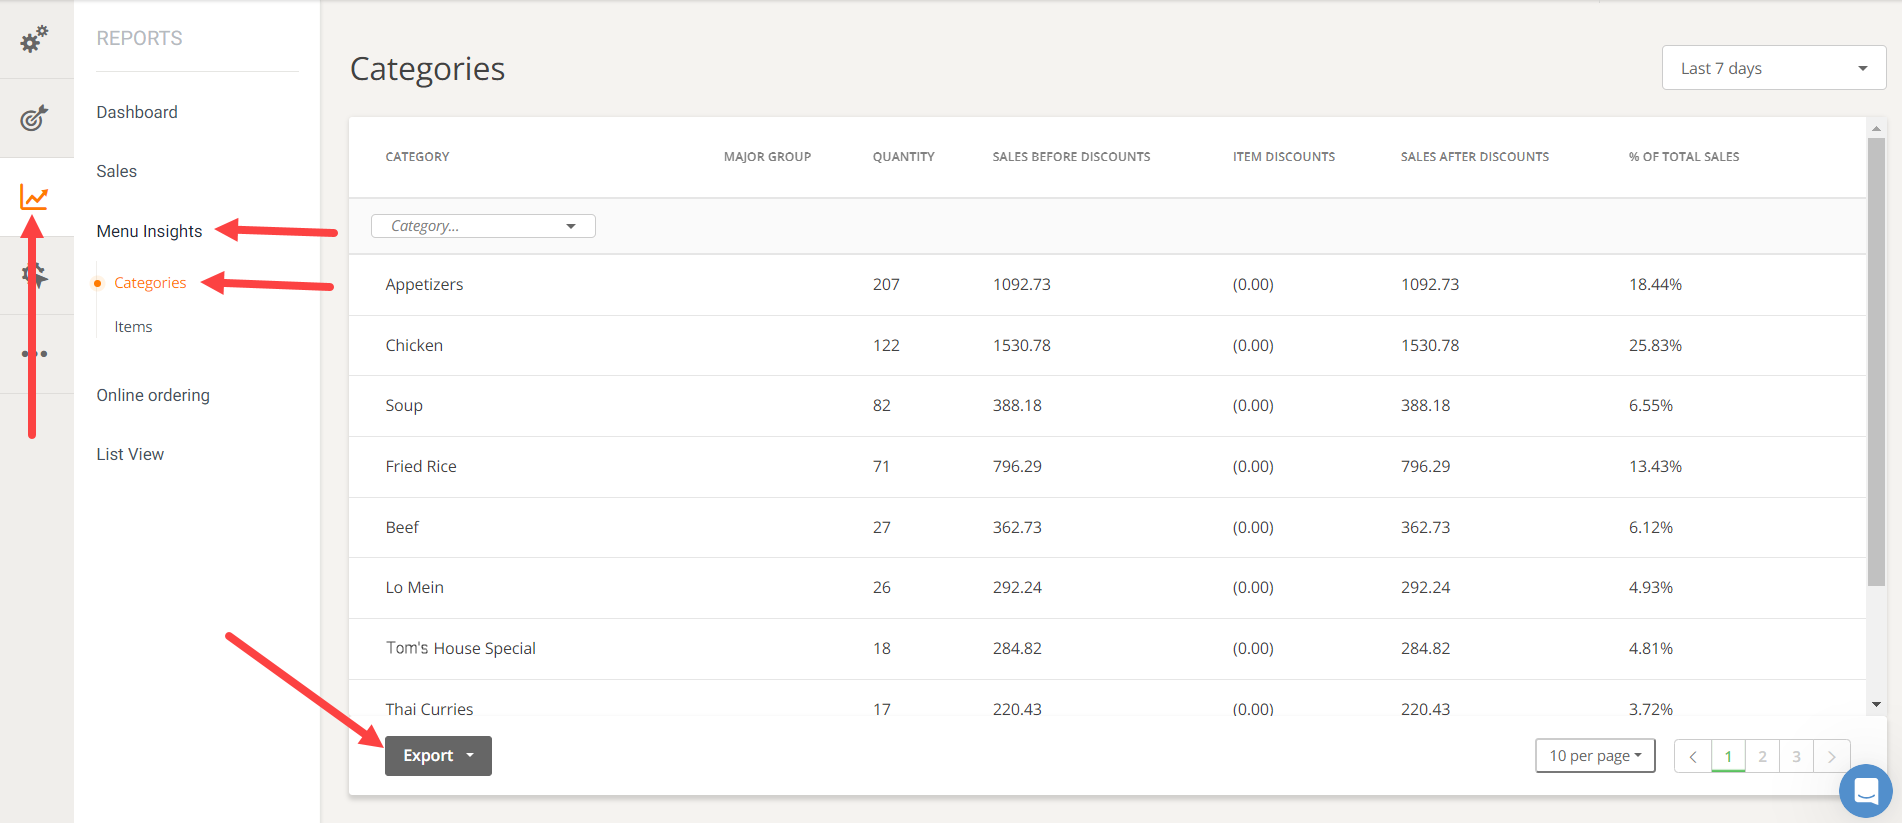
The quantity of menu items sold are displayed also per category, in the dedicated section:
Online ordering
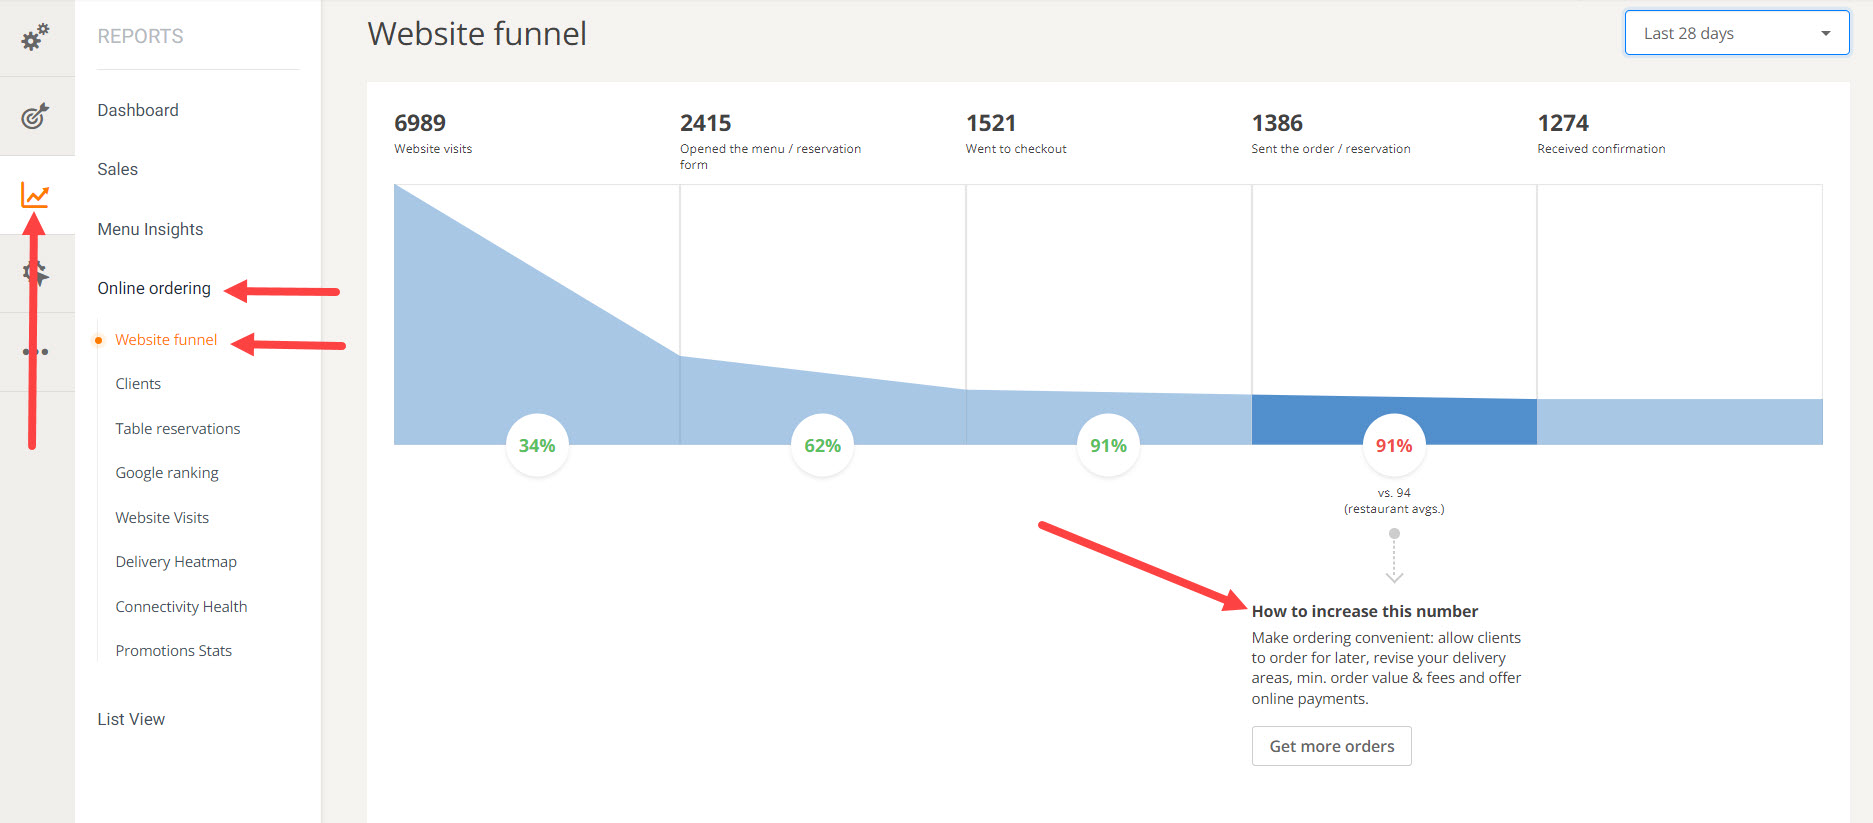
Website Funnel
The funnel shows the trajectory of the restaurant’s website visitors from the moment they visit the website to when they receive confirmation of their order, how many visitors turned into customers and how many got lost on the way, and on what step.
Hover with the mouse over each section of the funnel and on the bottom, to see whether there are some extra actions the restaurant can take to turn more visitors into customers.
Clients
The next section looks at clients and shows the number of new and returning clients on the time period selected by the restaurant manager. This report can also be exported in PDF, PNG or CSV formats. To get new clients and repeat business, we suggest working with the available marketing tools in the system. Click on “Create promo” or “Activate Autopilot” to start one.
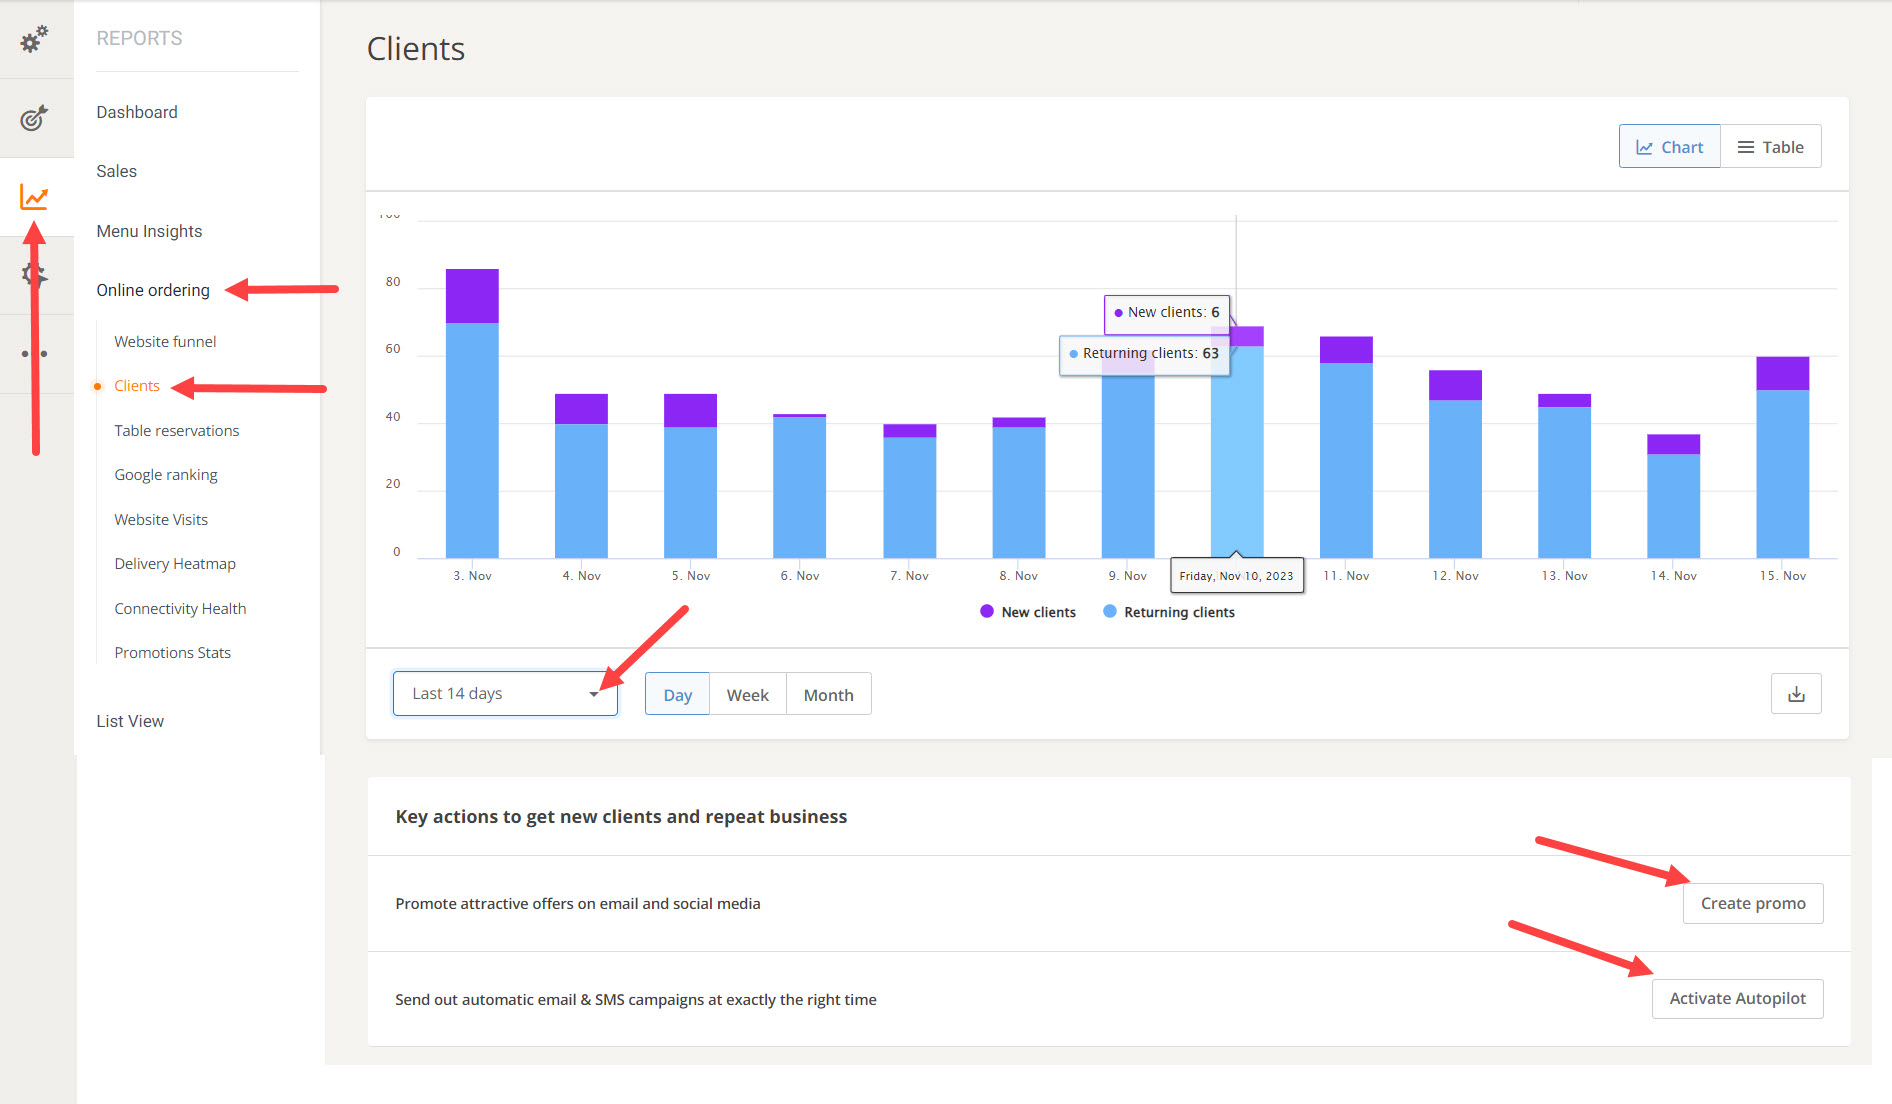
Table reservations
Under “Table reservations,” restaurant managers will see a chart/a table of how their table reservations have performed over time, according to the time period they select. They can also export the report as a PNG, PDF, or CSV.
If restaurants don’t have pre-ordering enabled for when people book a table, the account holder can do that from here by clicking on “Enable service.” This will encourage people to place a reservation.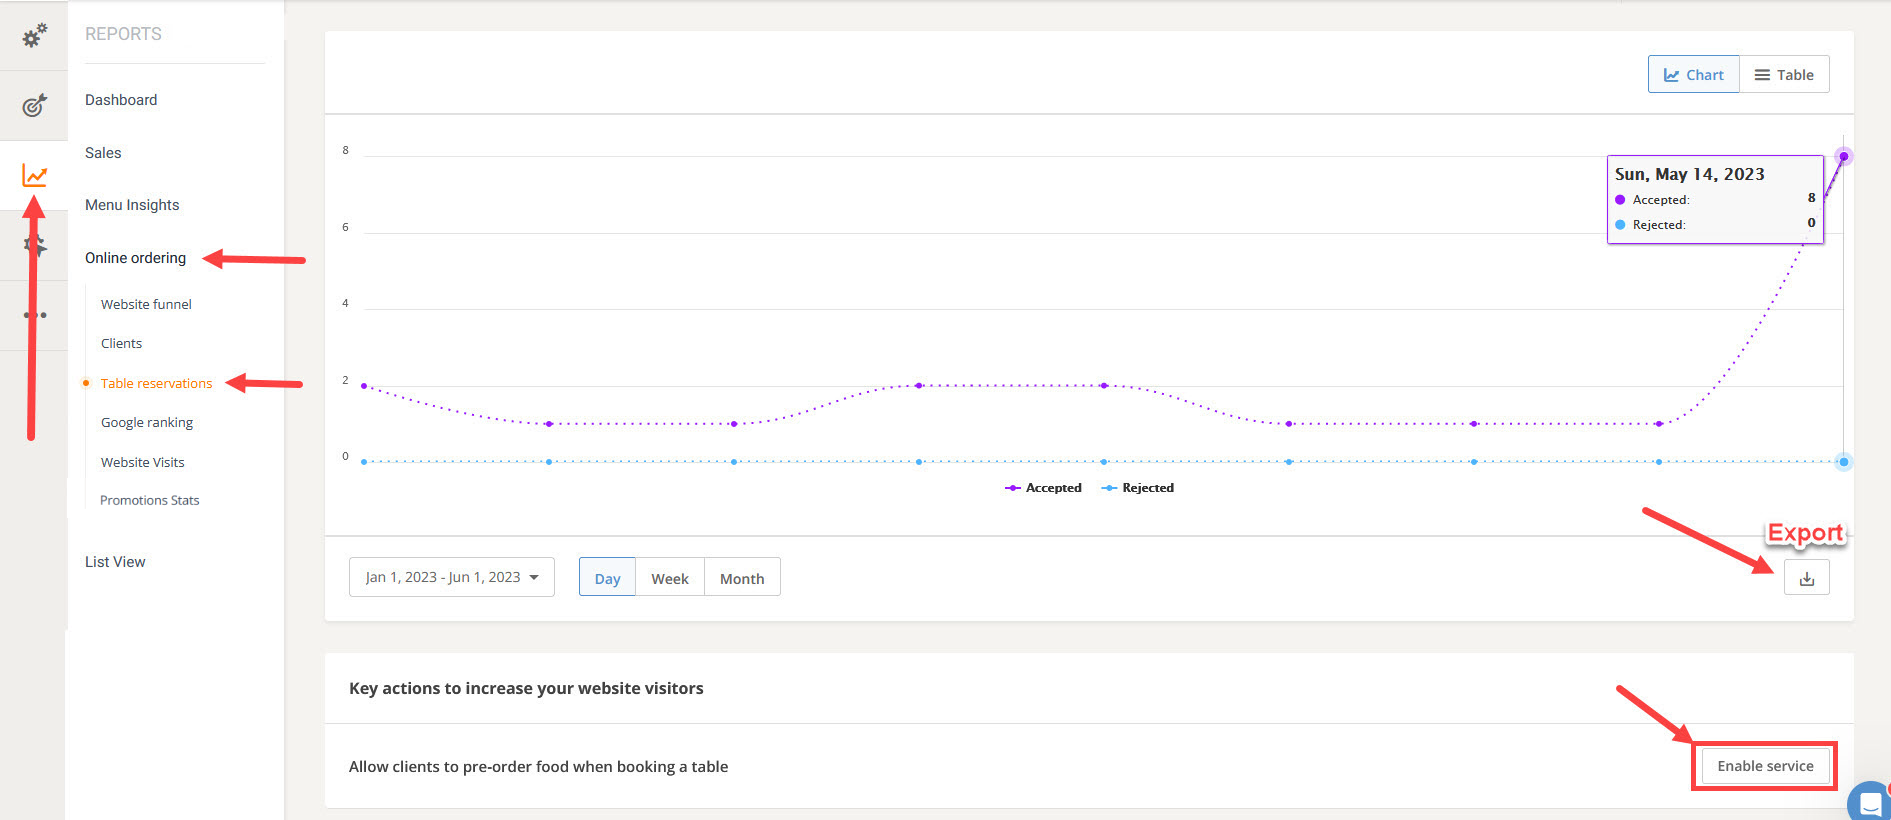
Google ranking
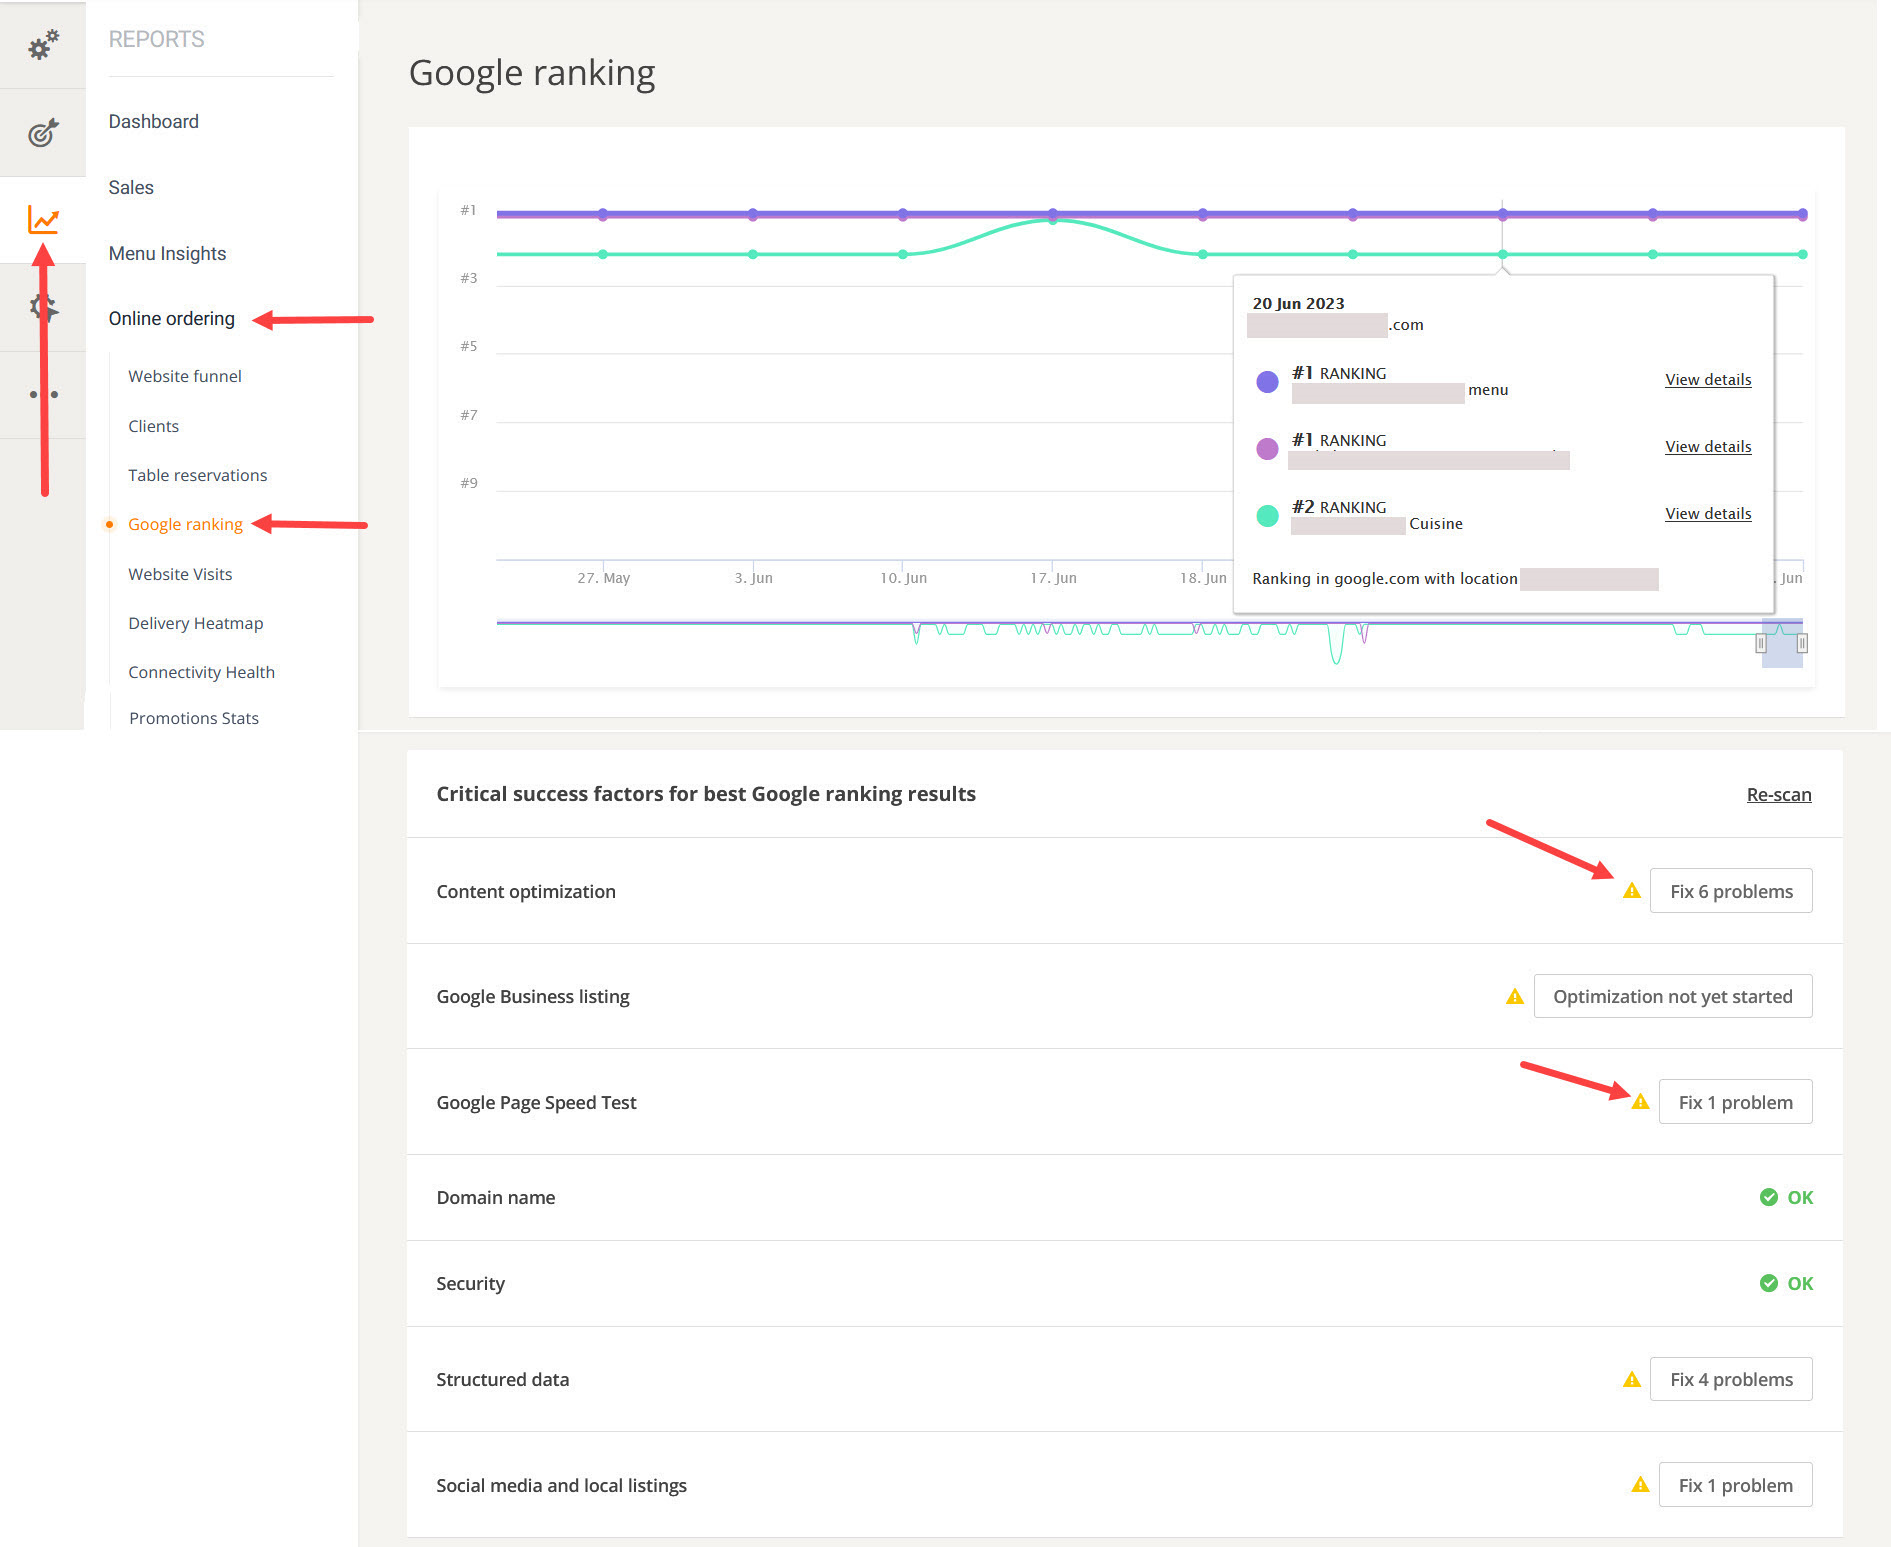
Moving on to the next section, restaurant managers can take a look at their Google ranking for important keywords that the restaurant is targeting. Here, a list of critical success factors is provided that help ranking better in Google. Click on the ones that are not performing as they should to learn how to fix the problem.
Website visits
In this section, restaurant managers have a more detailed look at website visits, as well as a list of tips the restaurant can implement. They can look at all website visits or filter them by channel or number of sessions, and they can also view the report as a chart or as a table.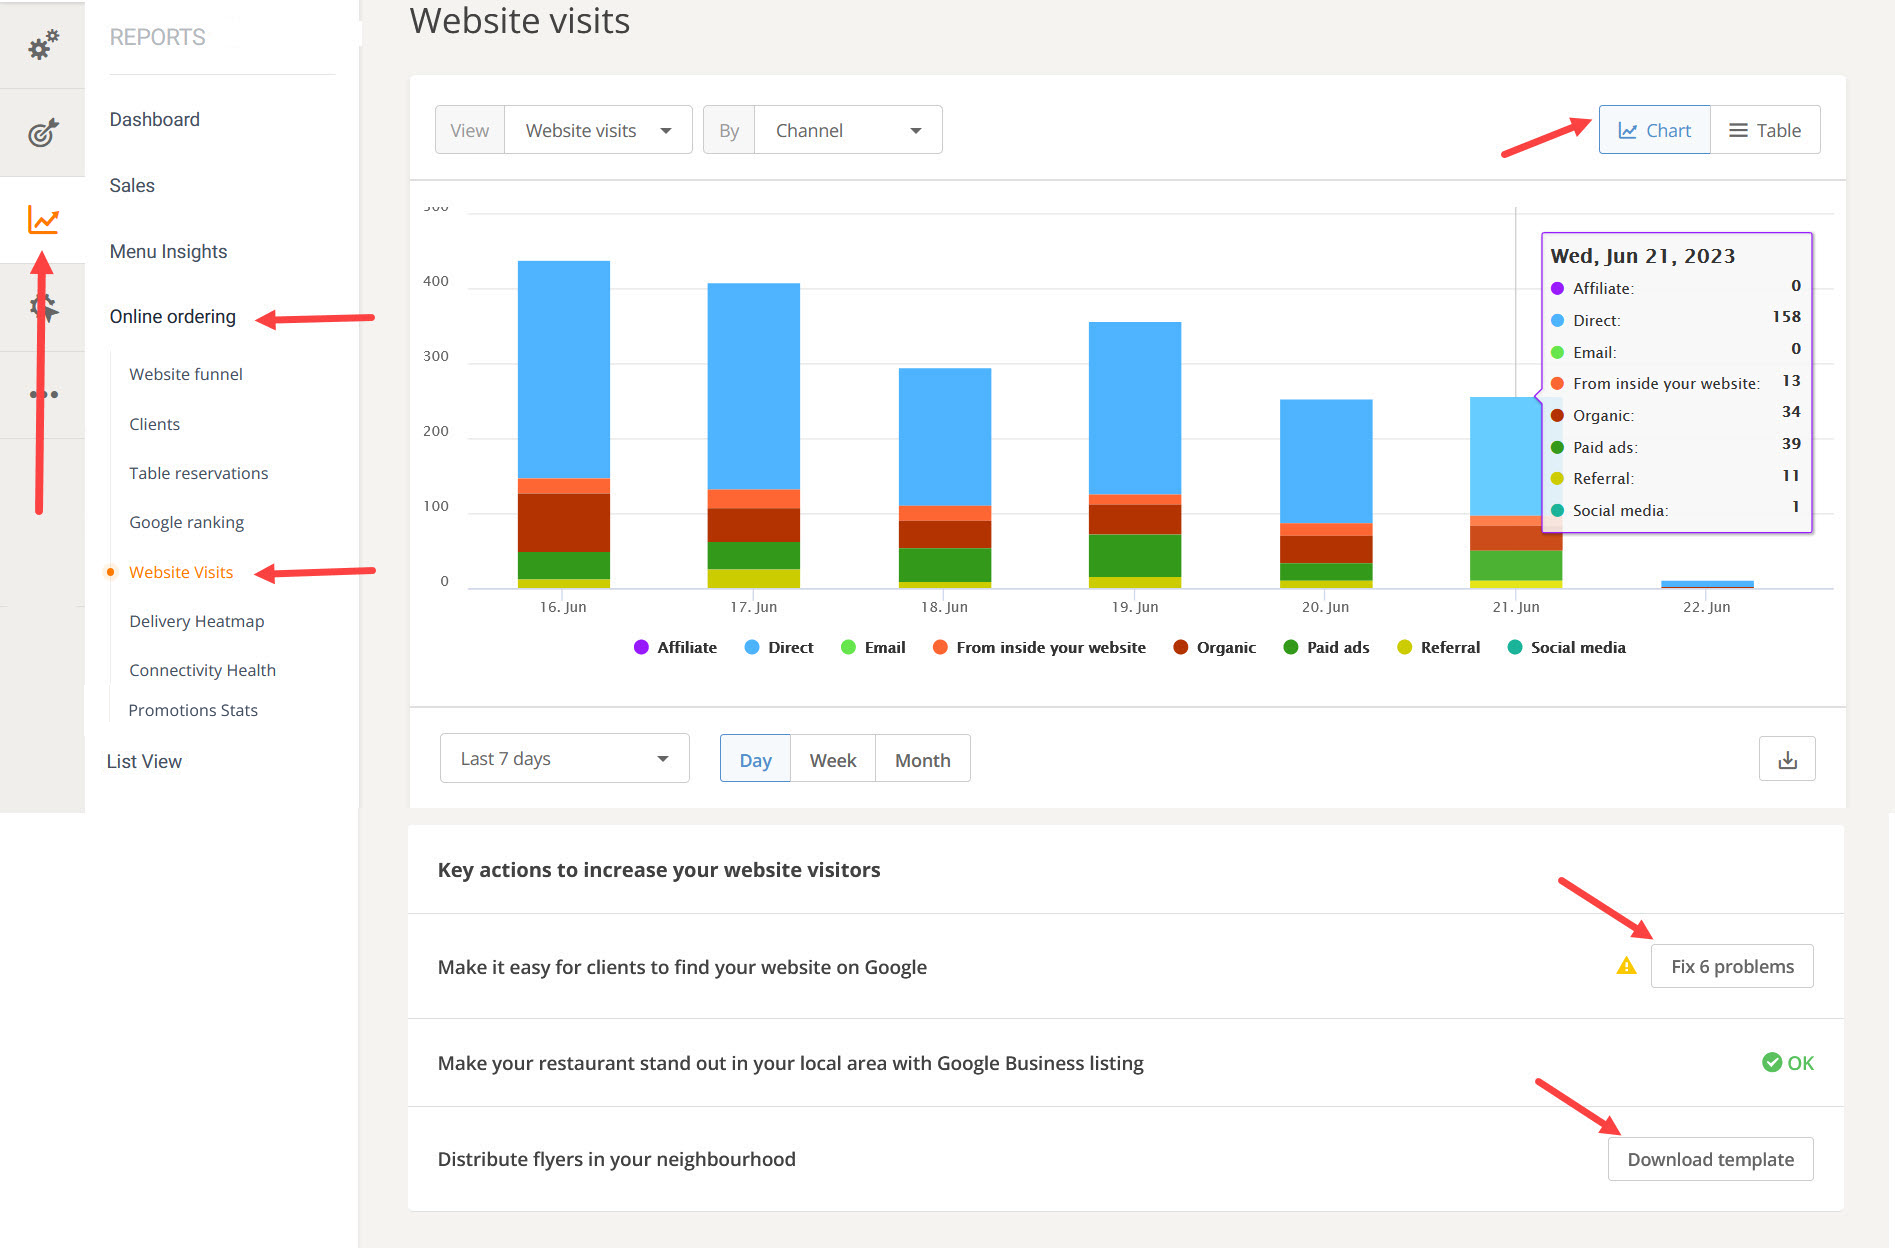
Delivery Heatmap (for restaurants with delivery service enabled)
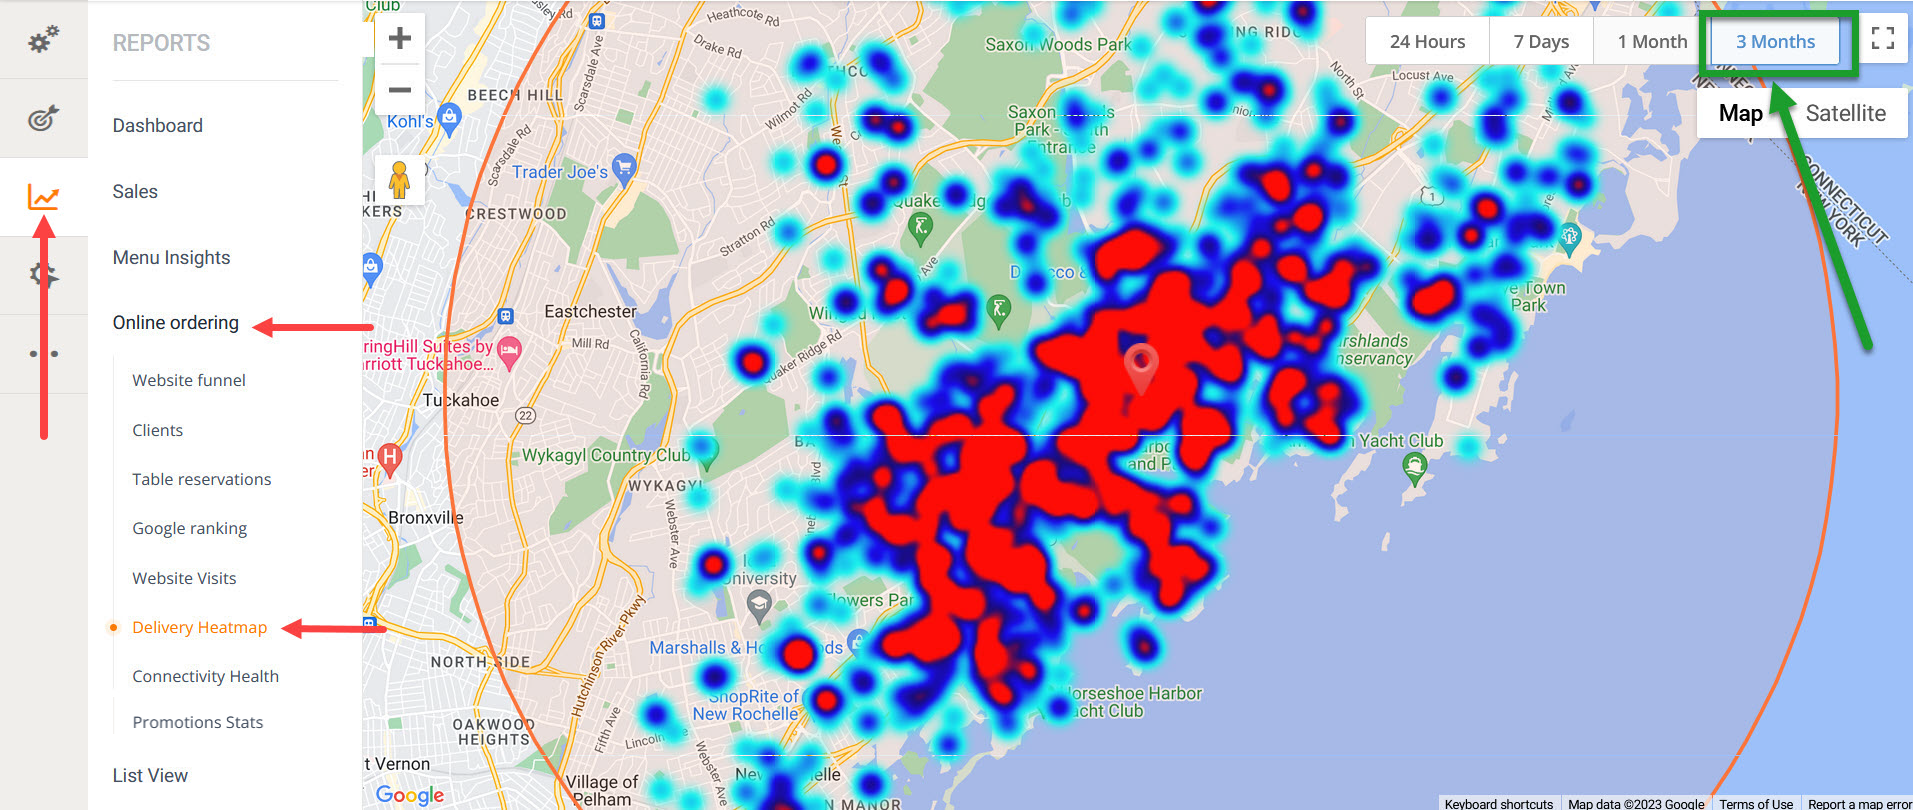
In this section restaurant managers will be able to see what are the delivery zones where they have made most deliveries and adjust their delivery settings or promotions accordingly:
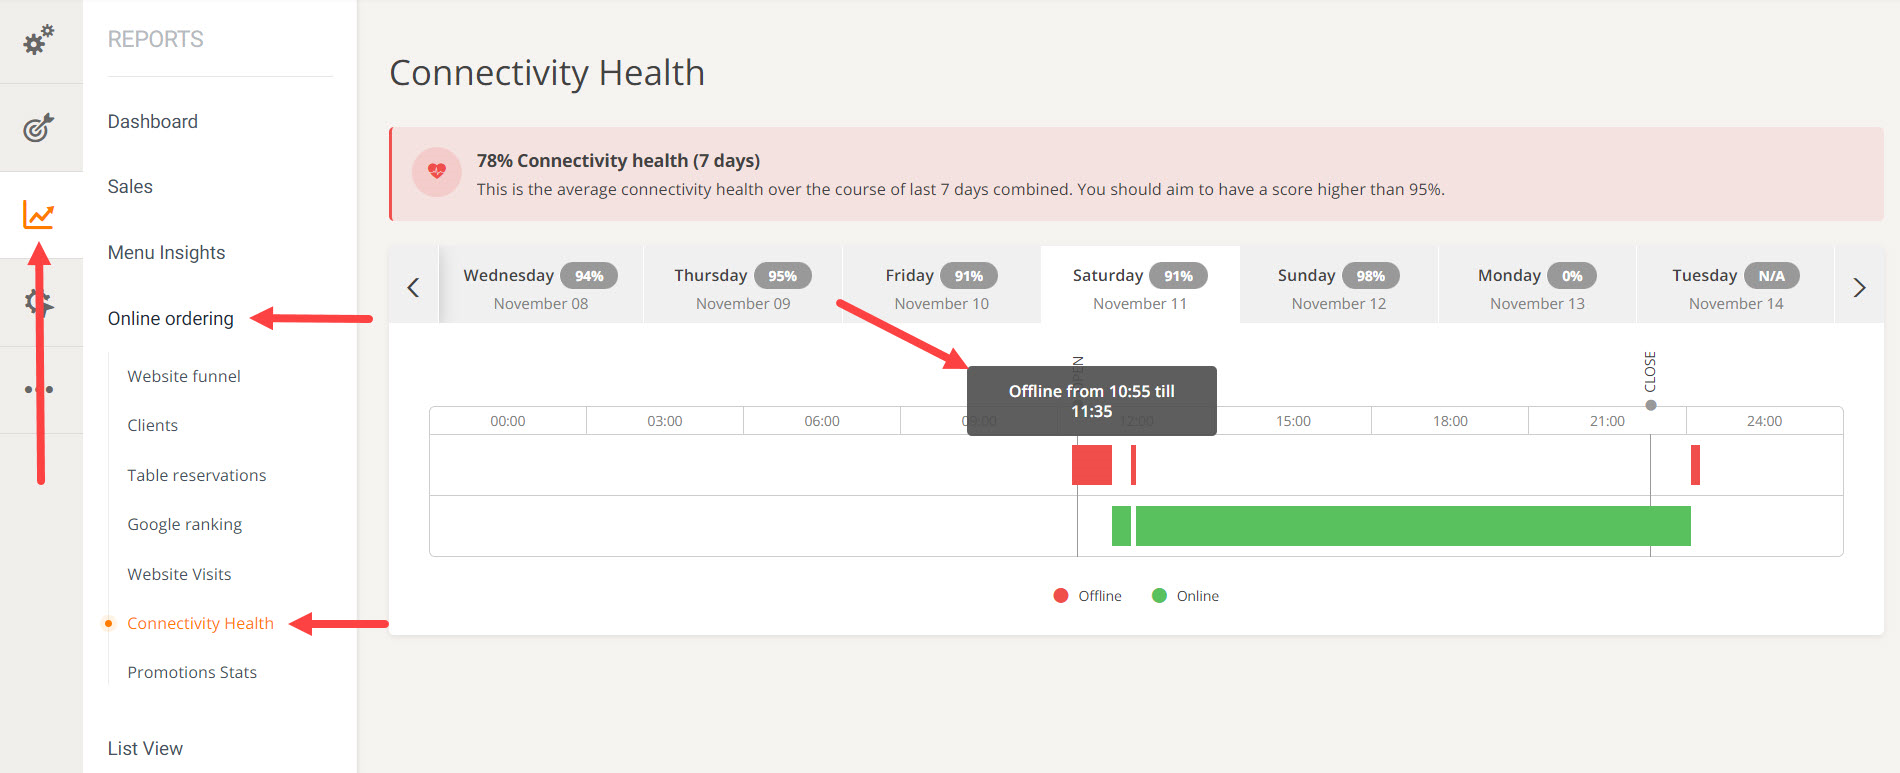
Connectivity Health
Under “Connectivity Health,” the restaurant manager can check the connectivity health of the restaurant’s order taking app. The score should be higher than 95% for it to be considered successful.
If there are connectivity issues, the account holder will see a connectivity alert. Click on the “Fix this” button to get more information on what to do to avoid this.
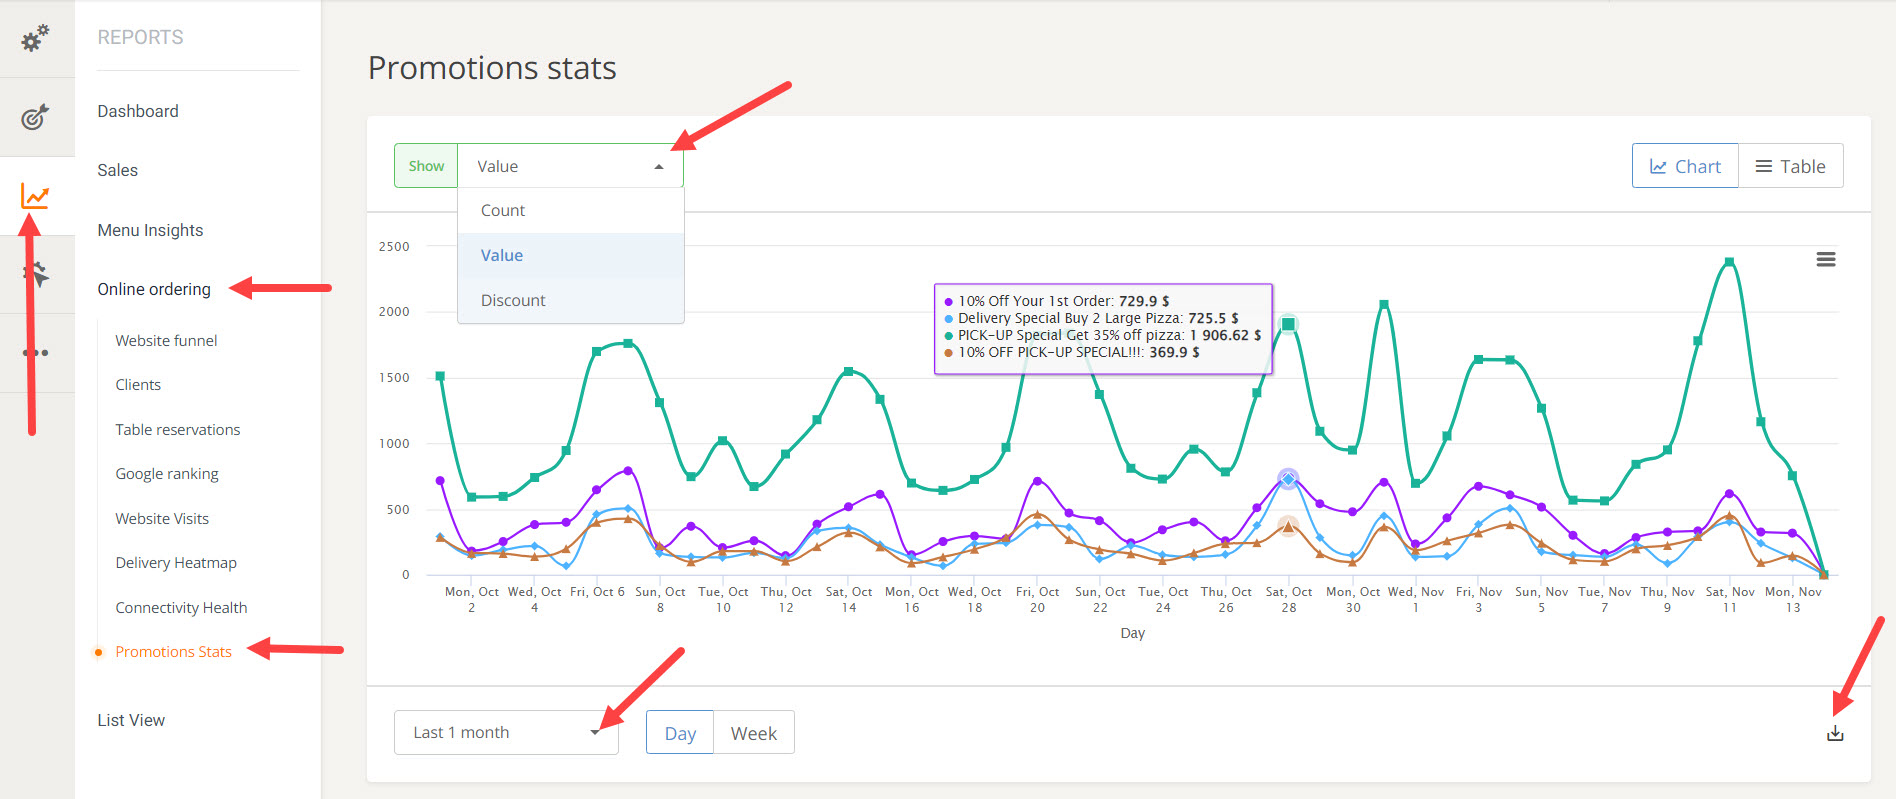
Promotion Stats
In the Promotion Stats section, restaurant owners can monitor the performance of their promo campaigns. They are able to view data by value, count and discount, to show data by various time intervals and to export it in a CSV or XLS format:
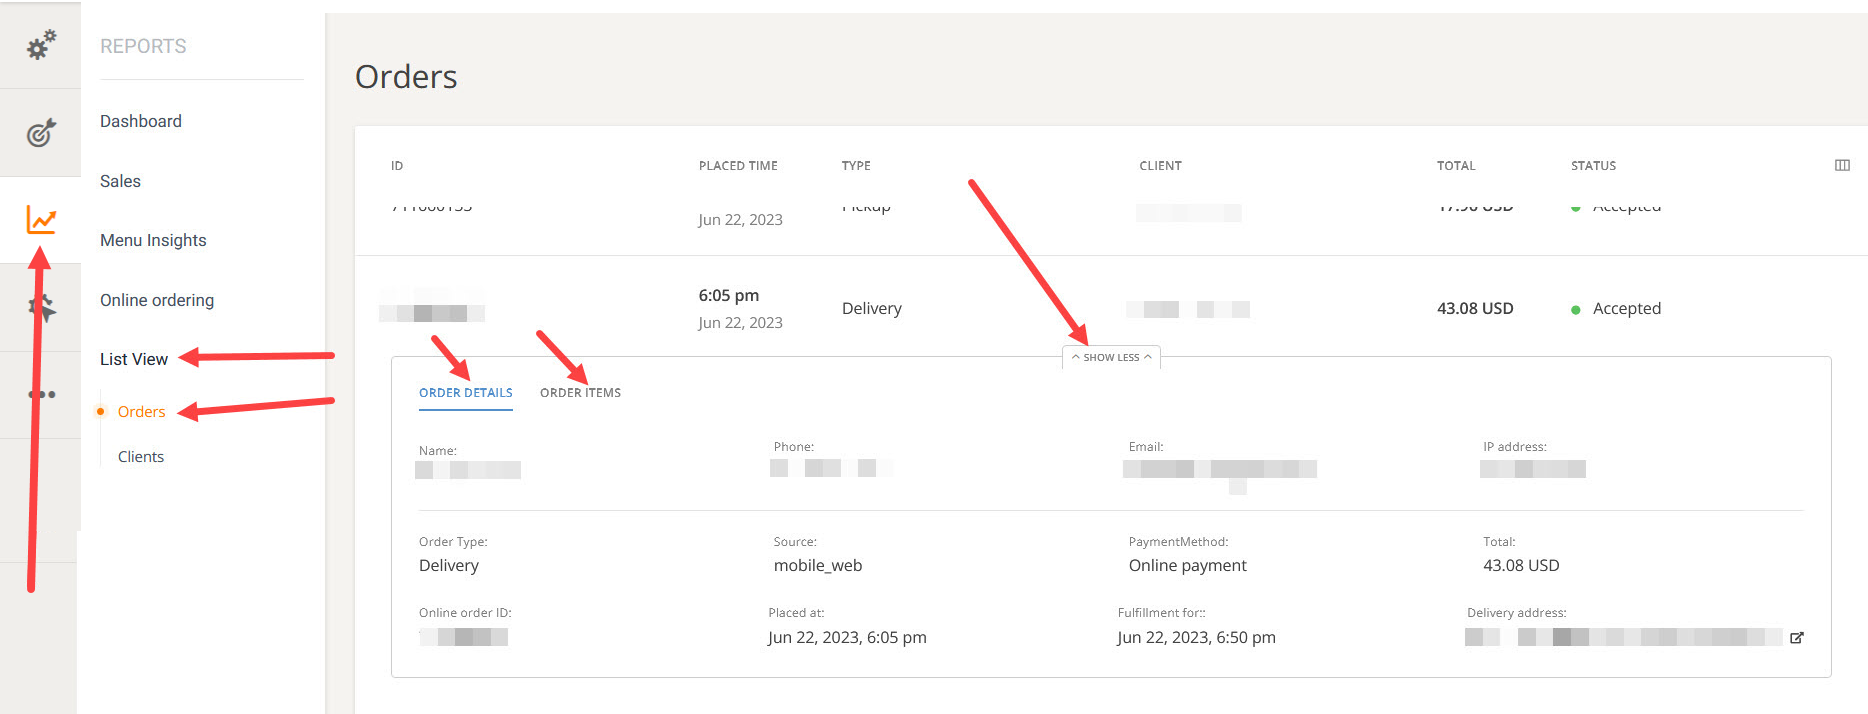
List View
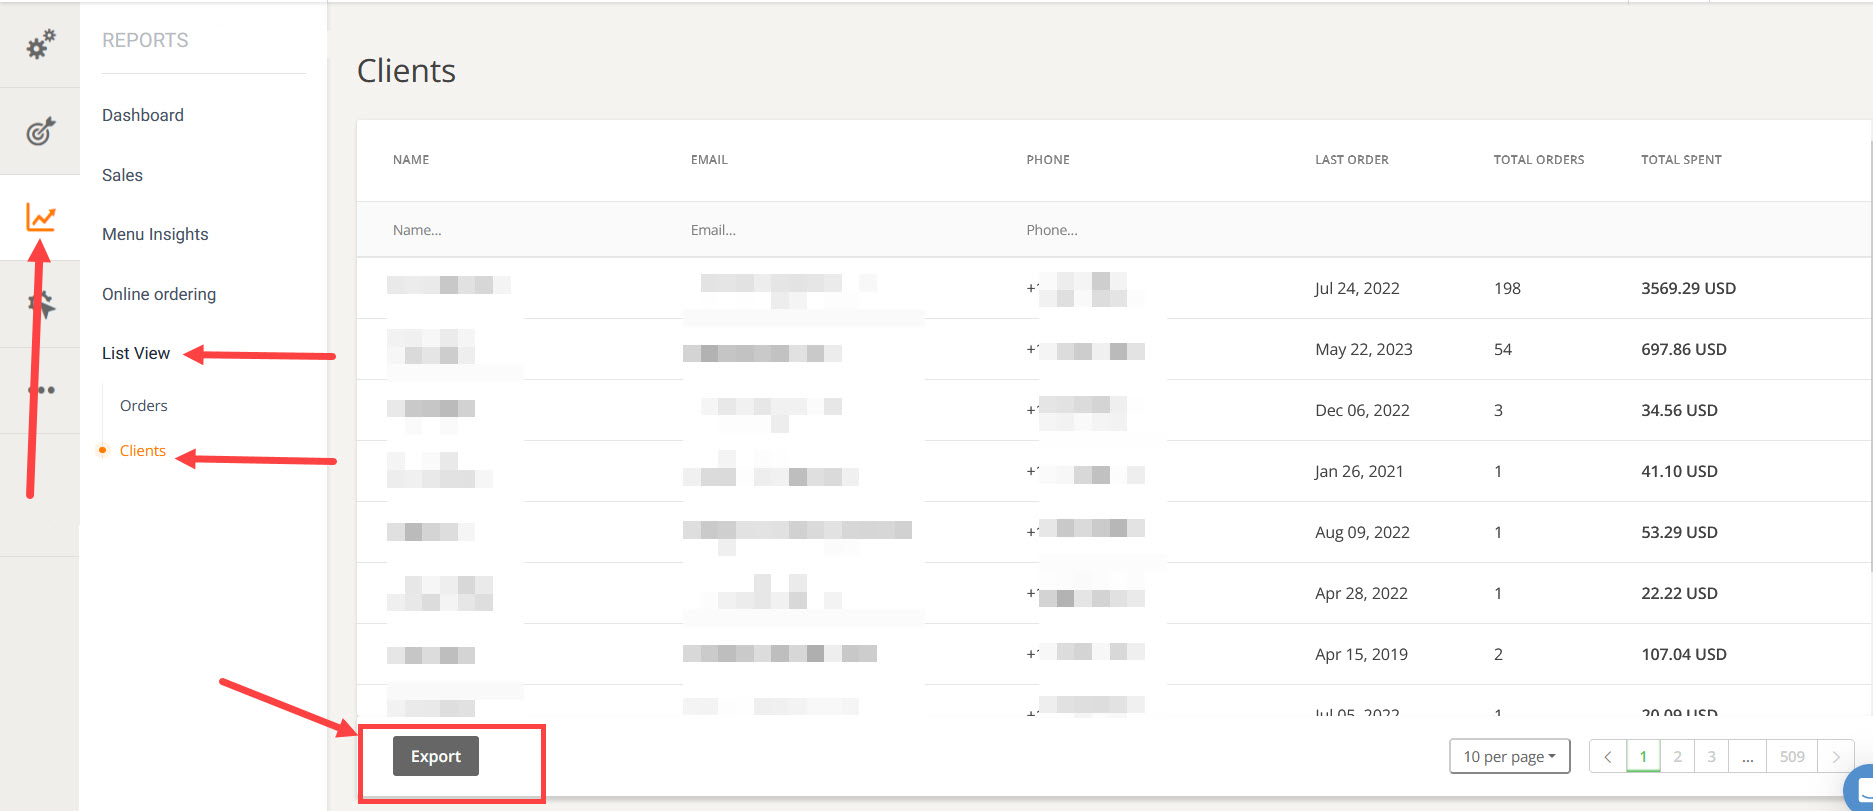
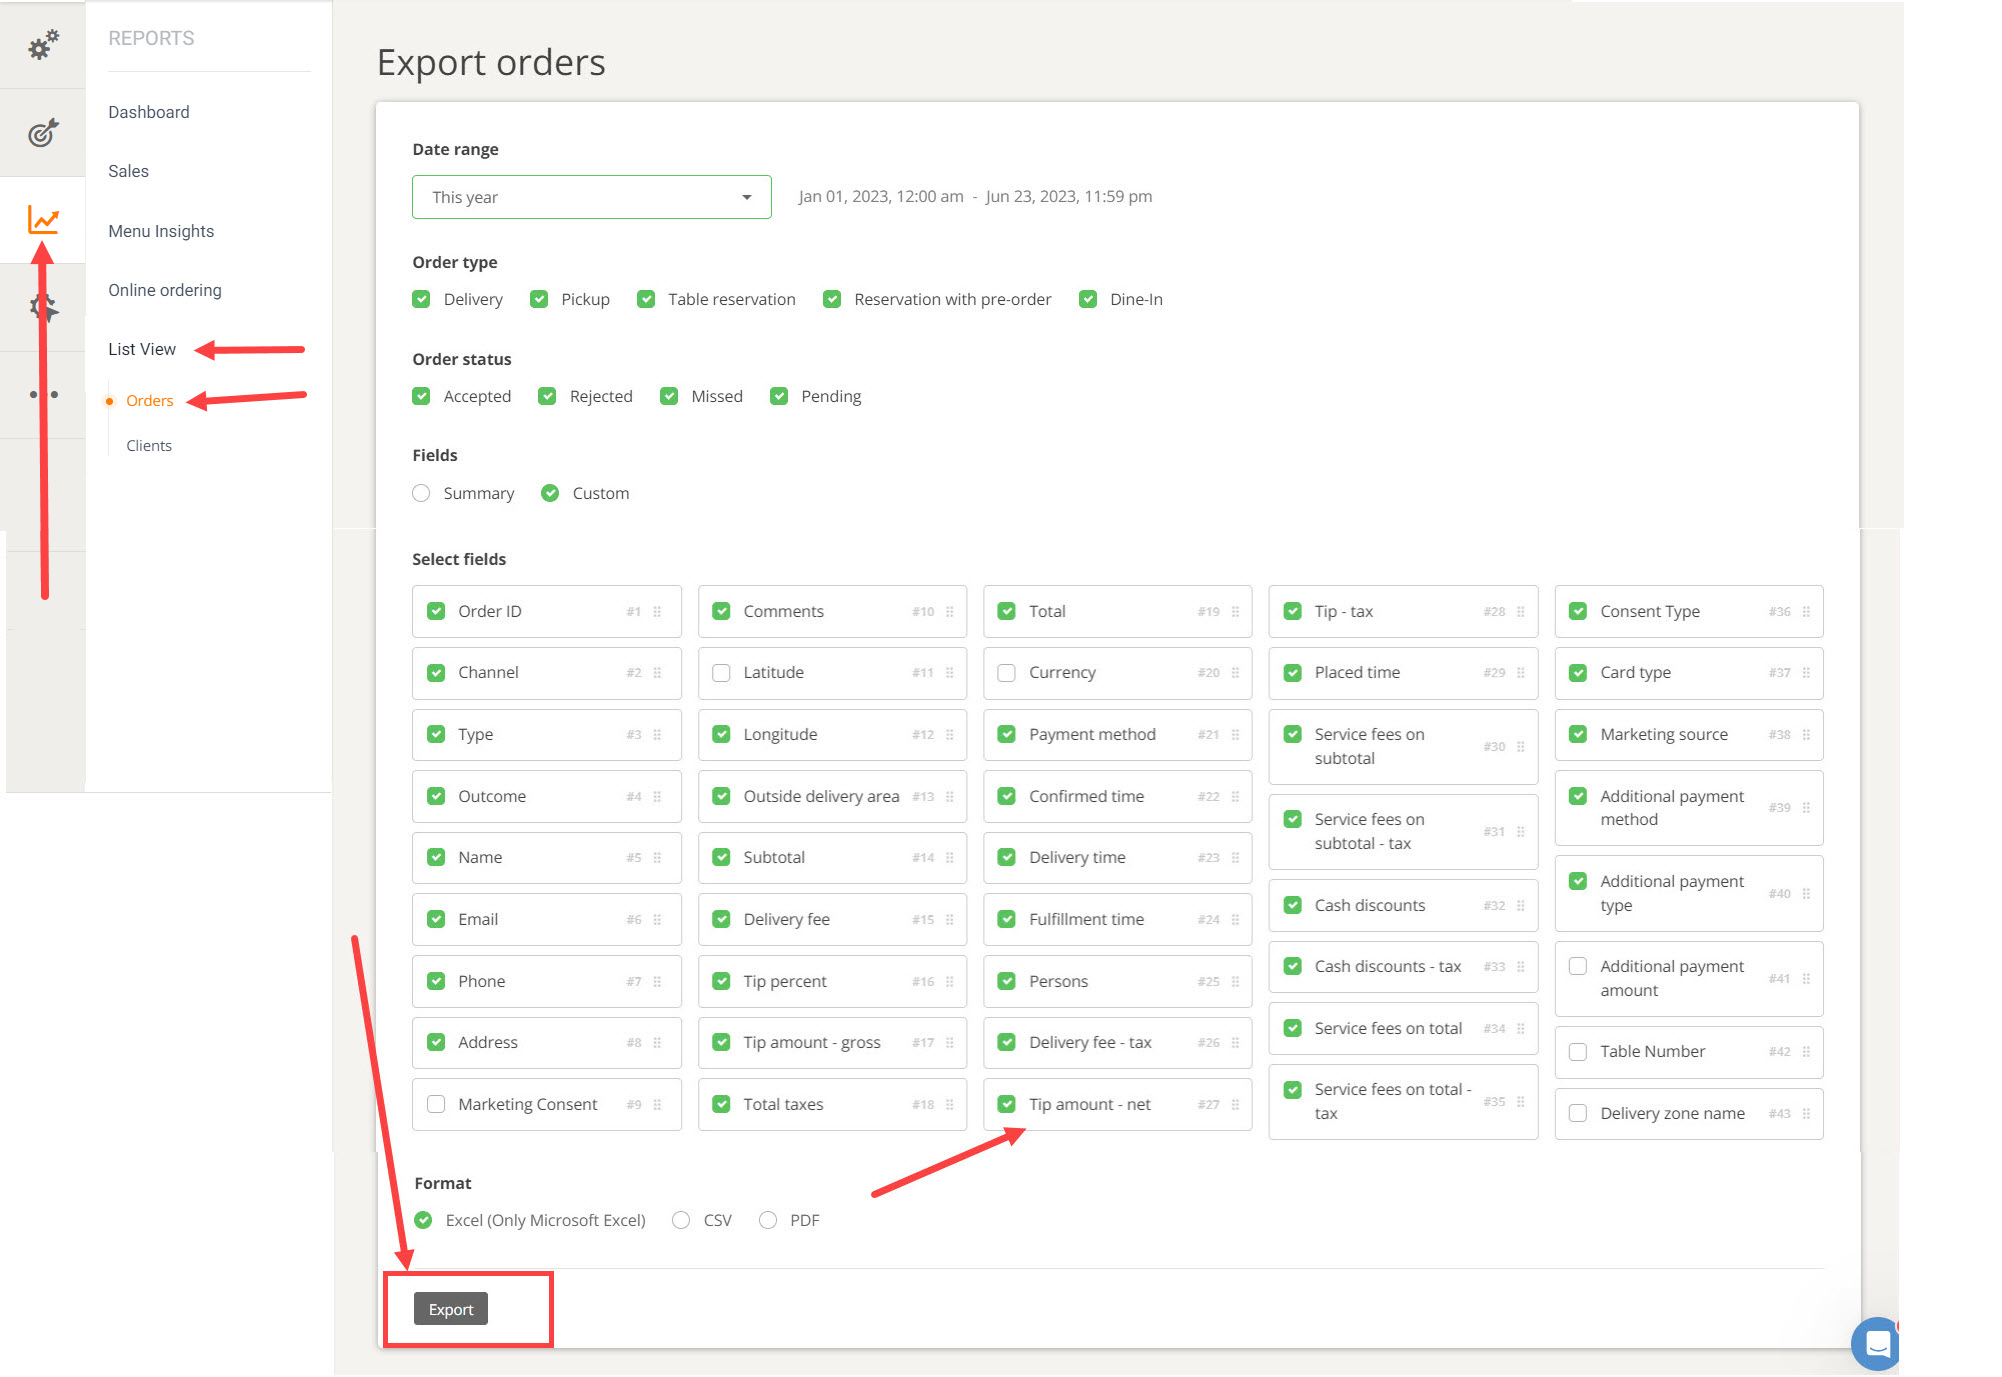
Finally, under “List View,” account holders can see a list of all orders, as well as clients. For orders, they can click on “Export all orders” to be taken to a page where they can filter them according to time, type, status, and a variety of custom fields. Add or remove parameters as needed for export. 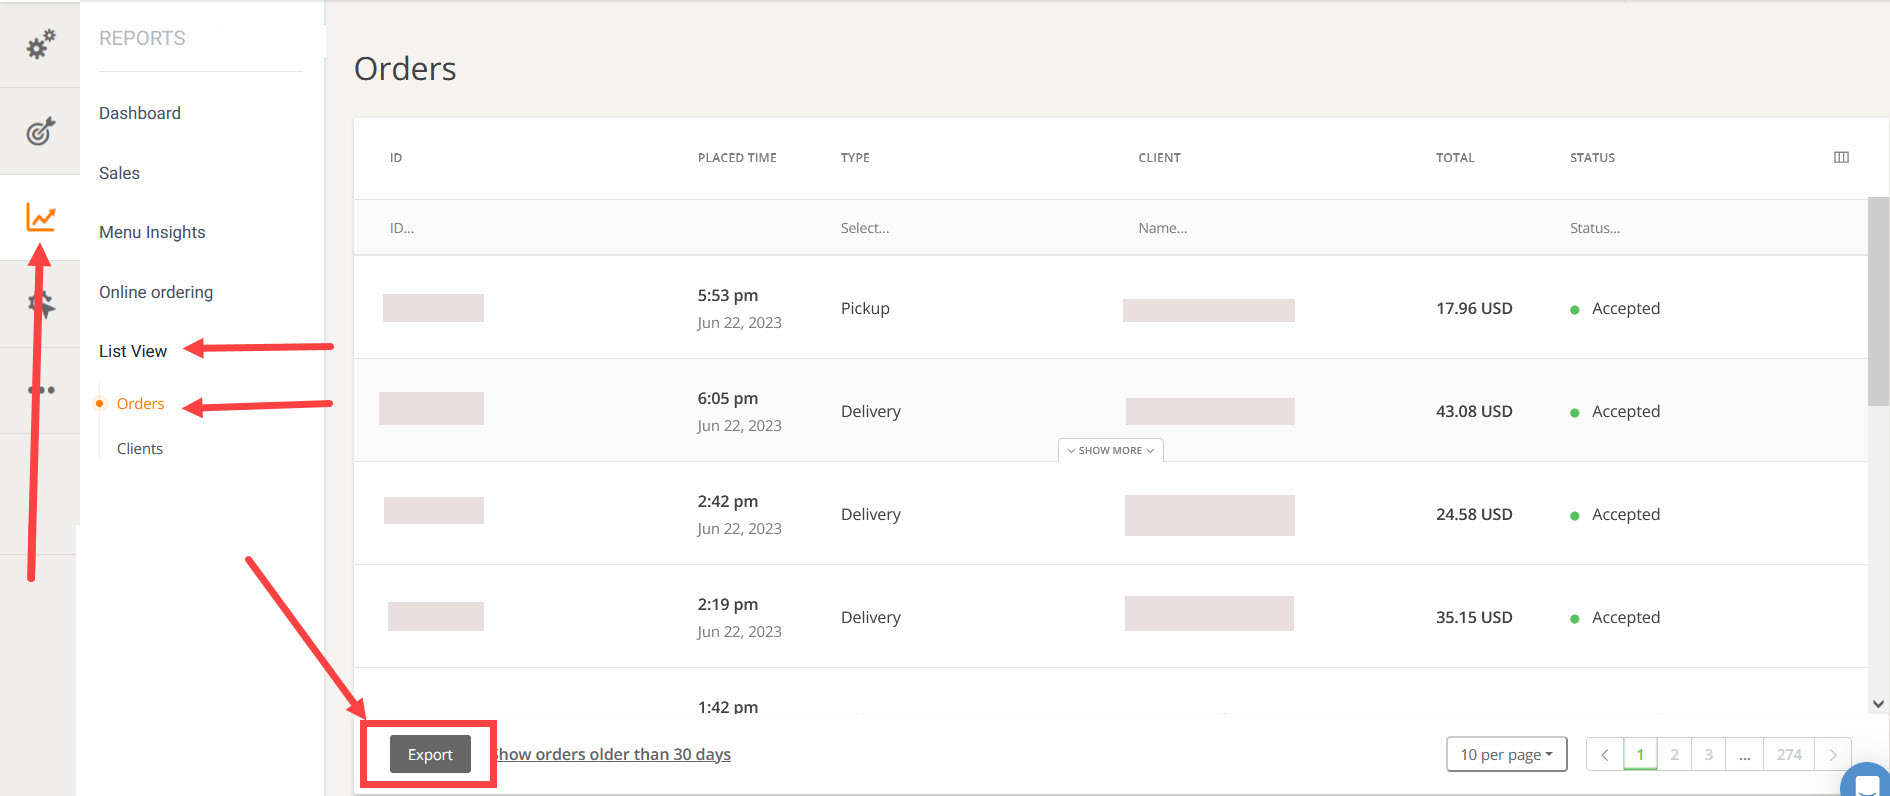
Clicking on “Show more”, at the bottom of an order line, allows account holders to see the details of that order and the list of items that were ordered:
The last type of report that can be exported is the “clients” one, where restaurant owners will get a list of all clients with their name, email address, phone number, total spent, total orders, and last order time.