Restaurant reports capture essential information such as sales patterns and seasonality, thus enabling restaurants to plan promotions, adjust staffing levels, and optimize inventory management.
This data also helps restaurant owners understand how each sales channel performs and how they can allocate resources to make the restaurant more profitable.
Read on to see how each area of the Reports section can provide useful insights into the restaurant business and how an owner can leverage this to grow their revenue.
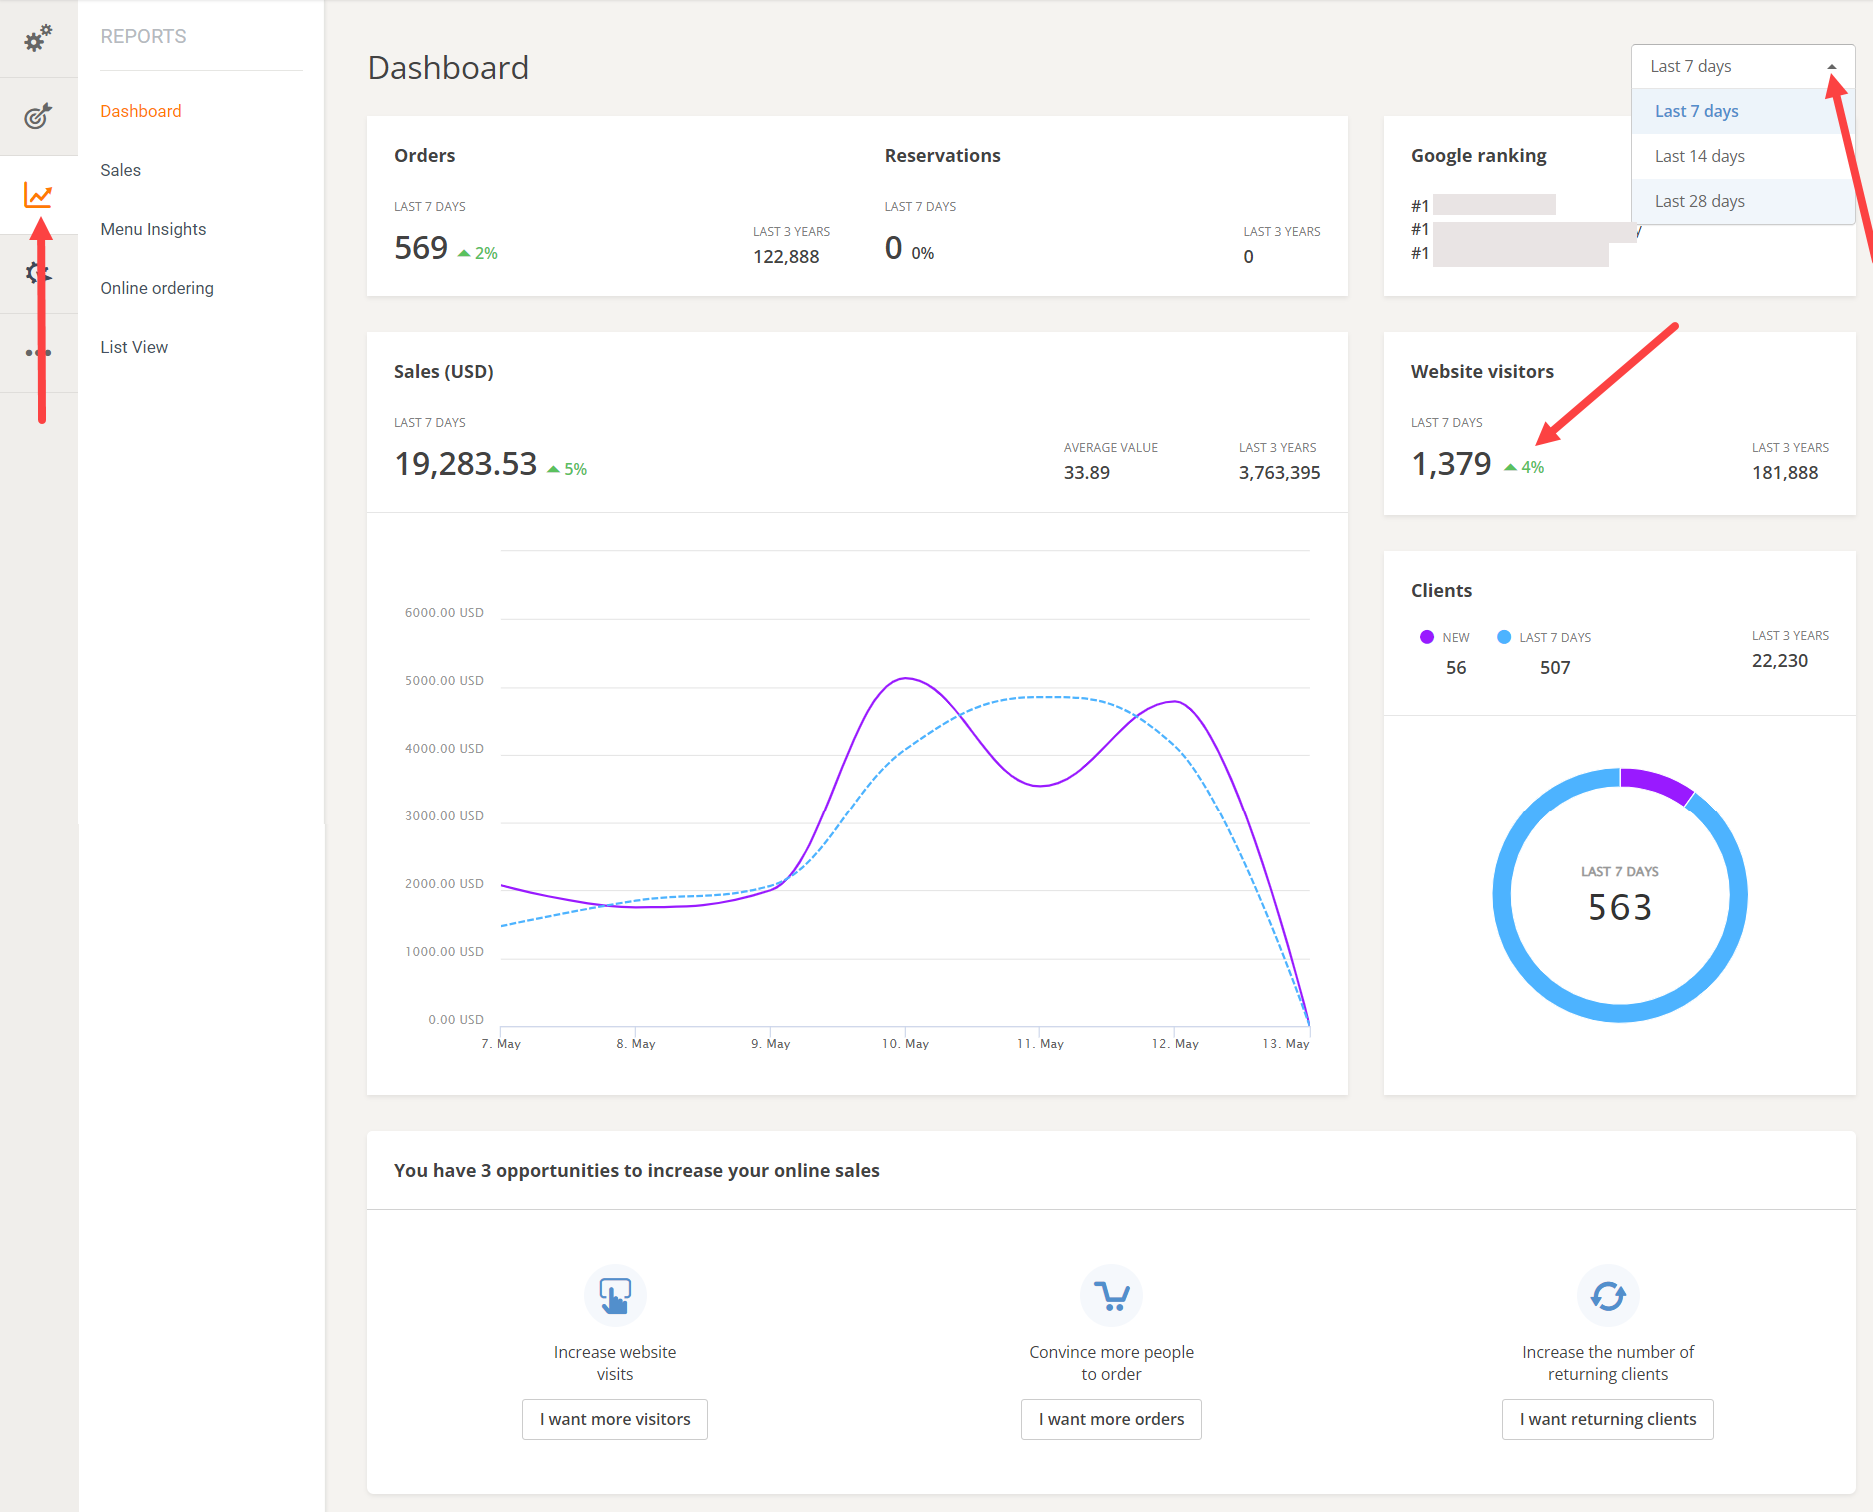
Dashboard
See the restaurant results at a glance and compare them to the previous period to determine what areas need improvement. If some of the results are visibly lacking, then check them in detail in one of the following sections.
Sales trend
Within the Sales Trend section, restaurant owners can view their total revenue from online orders, net sales, orders number or average order value by order type.
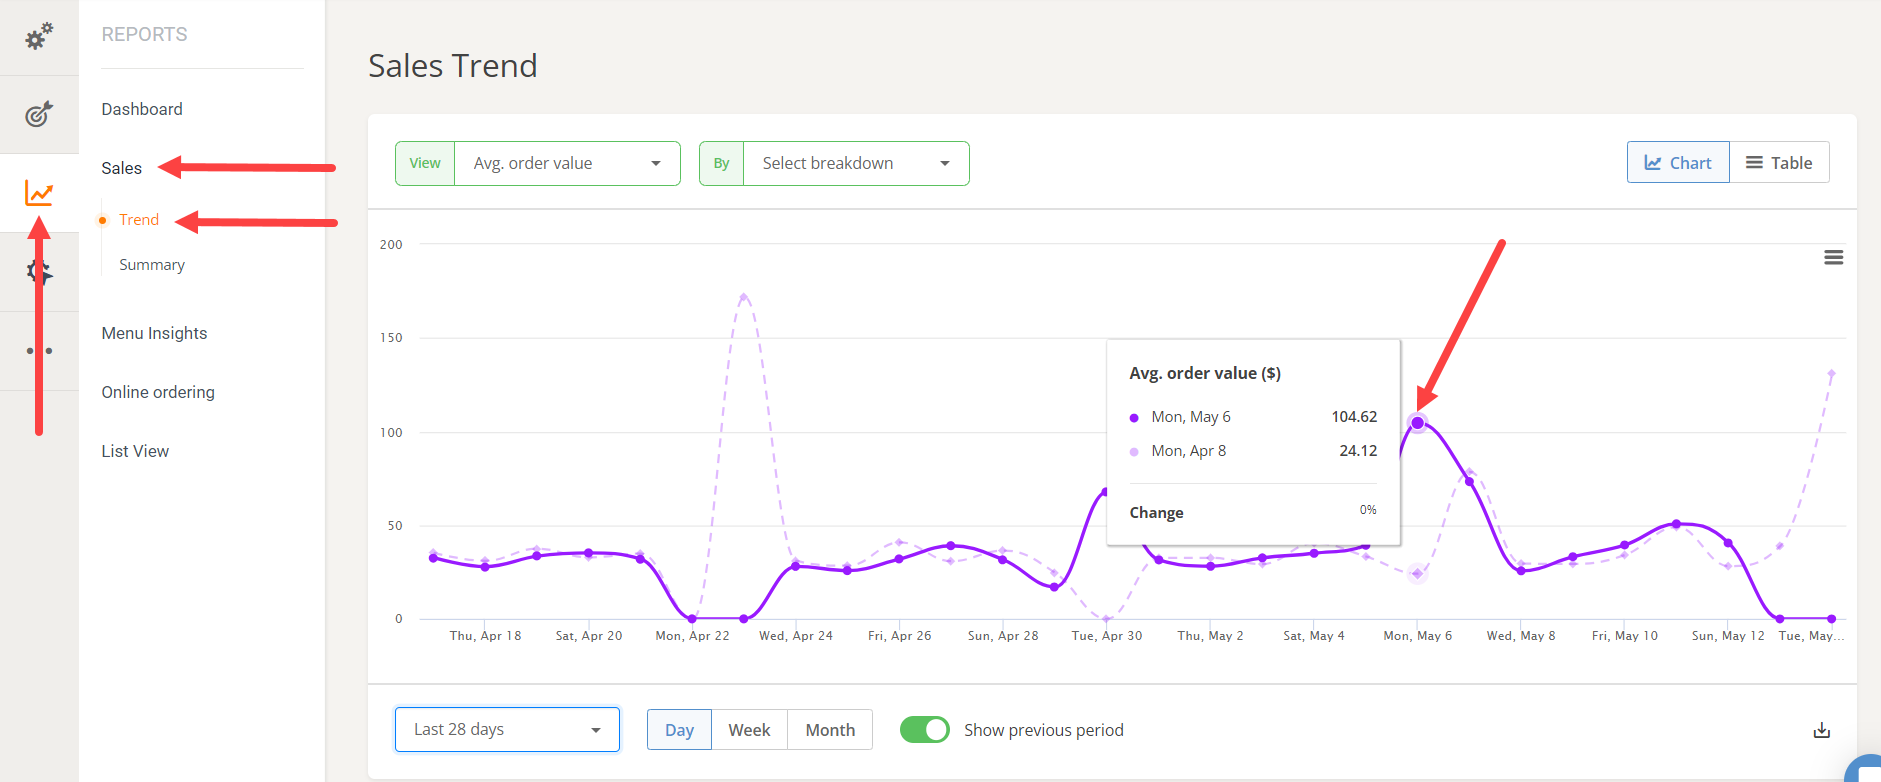
Analyze the results and depending on the conclusions, make sure to go back and see what activities generated these results. It might be a good idea to analyze the service availability or the food clients’ feedback and find ways to improve them.
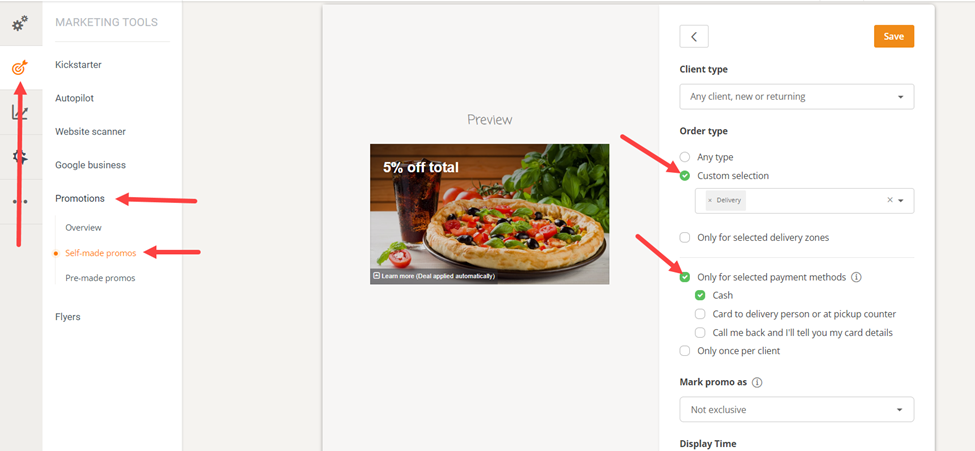
A restaurant owner can also take immediate action based on these numbers. For example, see what is the average order value. Then create a “free delivery promotion” to increase this amount.
Maybe consider creating an all-inclusive meal option that only costs that certain amount that the food client is willing to spend (i.e. if the average order value is $39.99, consider creating a meal option with soup, main dish and dessert for that amount).
Sales summary
Orders in the Sales summary section can be filtered by payment method or order type (e.g.: delivery/pickup). There are various ways to use the data in this section, depending on the restaurant’s goals:
- Stimulate the sales under a certain service: set up a promotion for the least popular service provided by the restaurant.
- Compare sales from different days and weeks to discover specific trends and see if operations can be adjusted, for example: increase staff on busiest days.
- Filter and compare sales by months to reveal seasonal variations and adjust offers accordingly. For example, give the restaurant menu a summer refresh by adding seasonal drinks or add seasonal side dishes when festivals and other local regular events take place.
- Analyze sales by service (ex: pickup, table reservation, delivery) and measure that service’s contribution to overall revenue to understand customer preference for each channel. For example, if delivery is preferred by food clients, but for the restaurant is not cost-effective because of delivery costs, the owner could try integrating with a specialized company to take care of the deliveries for them.
- Not in the least, use the data from this section to send a report to finance team / accounting / other owners if needed.
Menu insights
This section offers an overview of the quantity of sold menu items, the category where they belong, item discounts, % of total sales, sales after discounts per type of item.
Depending on the results, restaurant owners can:
- identify most popular menu items to adjust inventory accordingly. For example they could make sure they have at hand the ingredients for the most requested dishes on busy days, or they could highlight them more in the menu with high-quality photos;
- compare sales patterns of menu items and identify seasonality of certain menu items. For example to see what dishes are selling in the holiday season or at lunch vs evening etc.;
- see what menu items are low-performing and decide if they need to be replaced in the menu, or try to make them more visible in the menu or promote them. For example remove from the menu the dishes that have higher production costs and do not sell;
- move the products with high margin to a visible place in the menu and add appealing images;
-
implement a “% discount on selected items” promo for certain items/categories
Online ordering
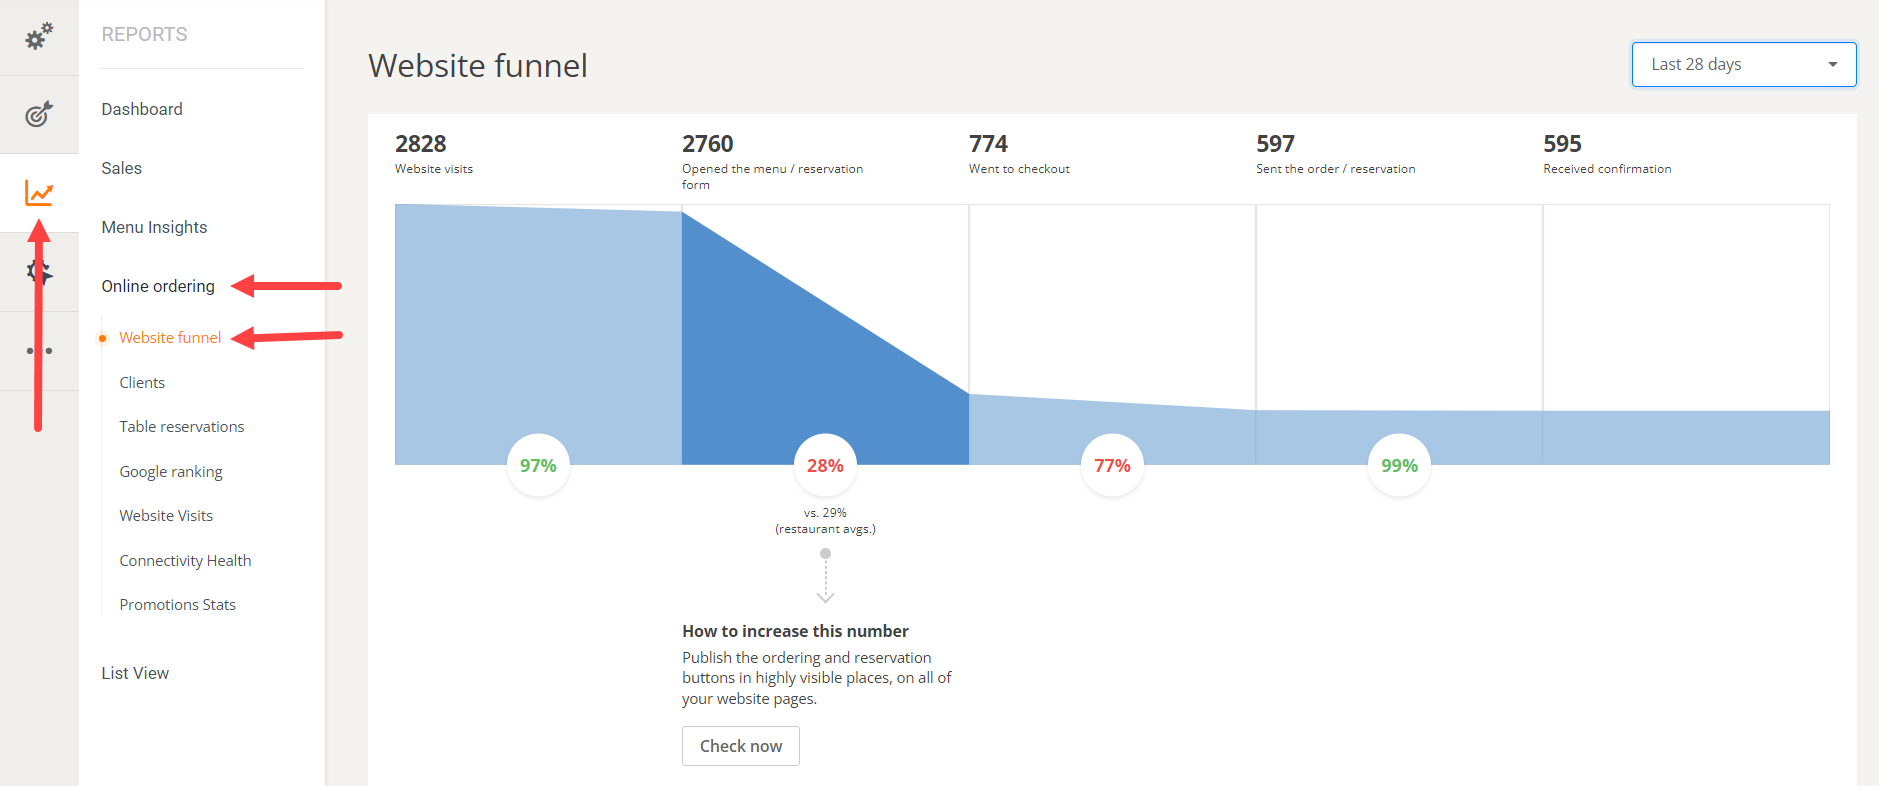
Website Funnel
This section shows how many visitors go through each stage of the sales process and compares them to the general average in the system. When there is room for improvement, the buttons below the chart lead to a dedicated list of suggestions. Depending on the area that is lacking, these may include: organizing website content, adding a security certificate, having the ordering and/or reservation widgets in sight at all times while navigating the website or adding links to social media listings and review portals. Read more about these in this article.
Clients
Export and analyze data in this section and employ a Kickstarter campaign, promotions and the Autopilot campaigns to encourage repeat business.
If there is a large number of new food clients compared to returning clients and the restaurant is in business for a while, check the customer feedback, pricing, and other data you may have, to understand why clients do not place a second order and improve on the discovery. For example if the service was lacking, train the restaurant staff to improve the customer experience.
If there is a large number of returning clients, but very few new customers, restaurant owners may want to step up their advertising, social media campaigns and print out some flyers and distribute them in the neighborhood; place some posters highlighting certain products or promotions at the restaurant’s location too.
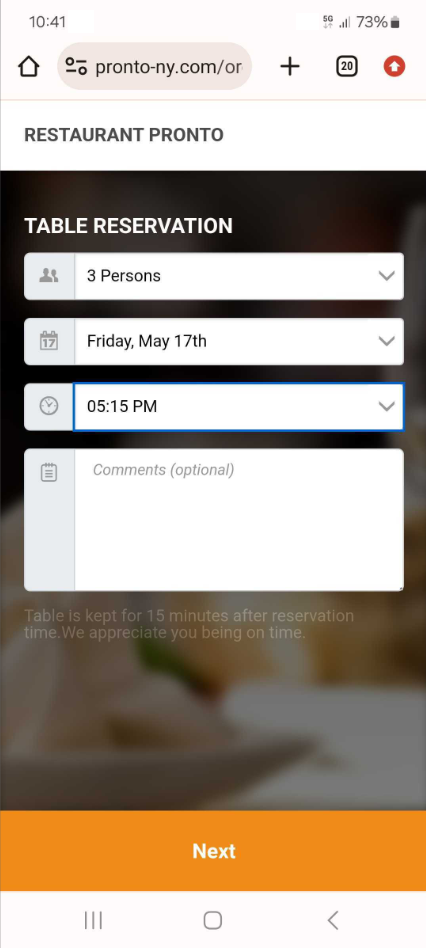
Table reservations
If restaurants don’t have pre-ordering enabled for when people book a table, the account holder can enable this service and republish the menu widget to their website. The restaurant owner will be redirected to the table reservation section and will need to enable the “Allow guests to pre-order their food when booking a table” section. This will encourage people to place a reservation.
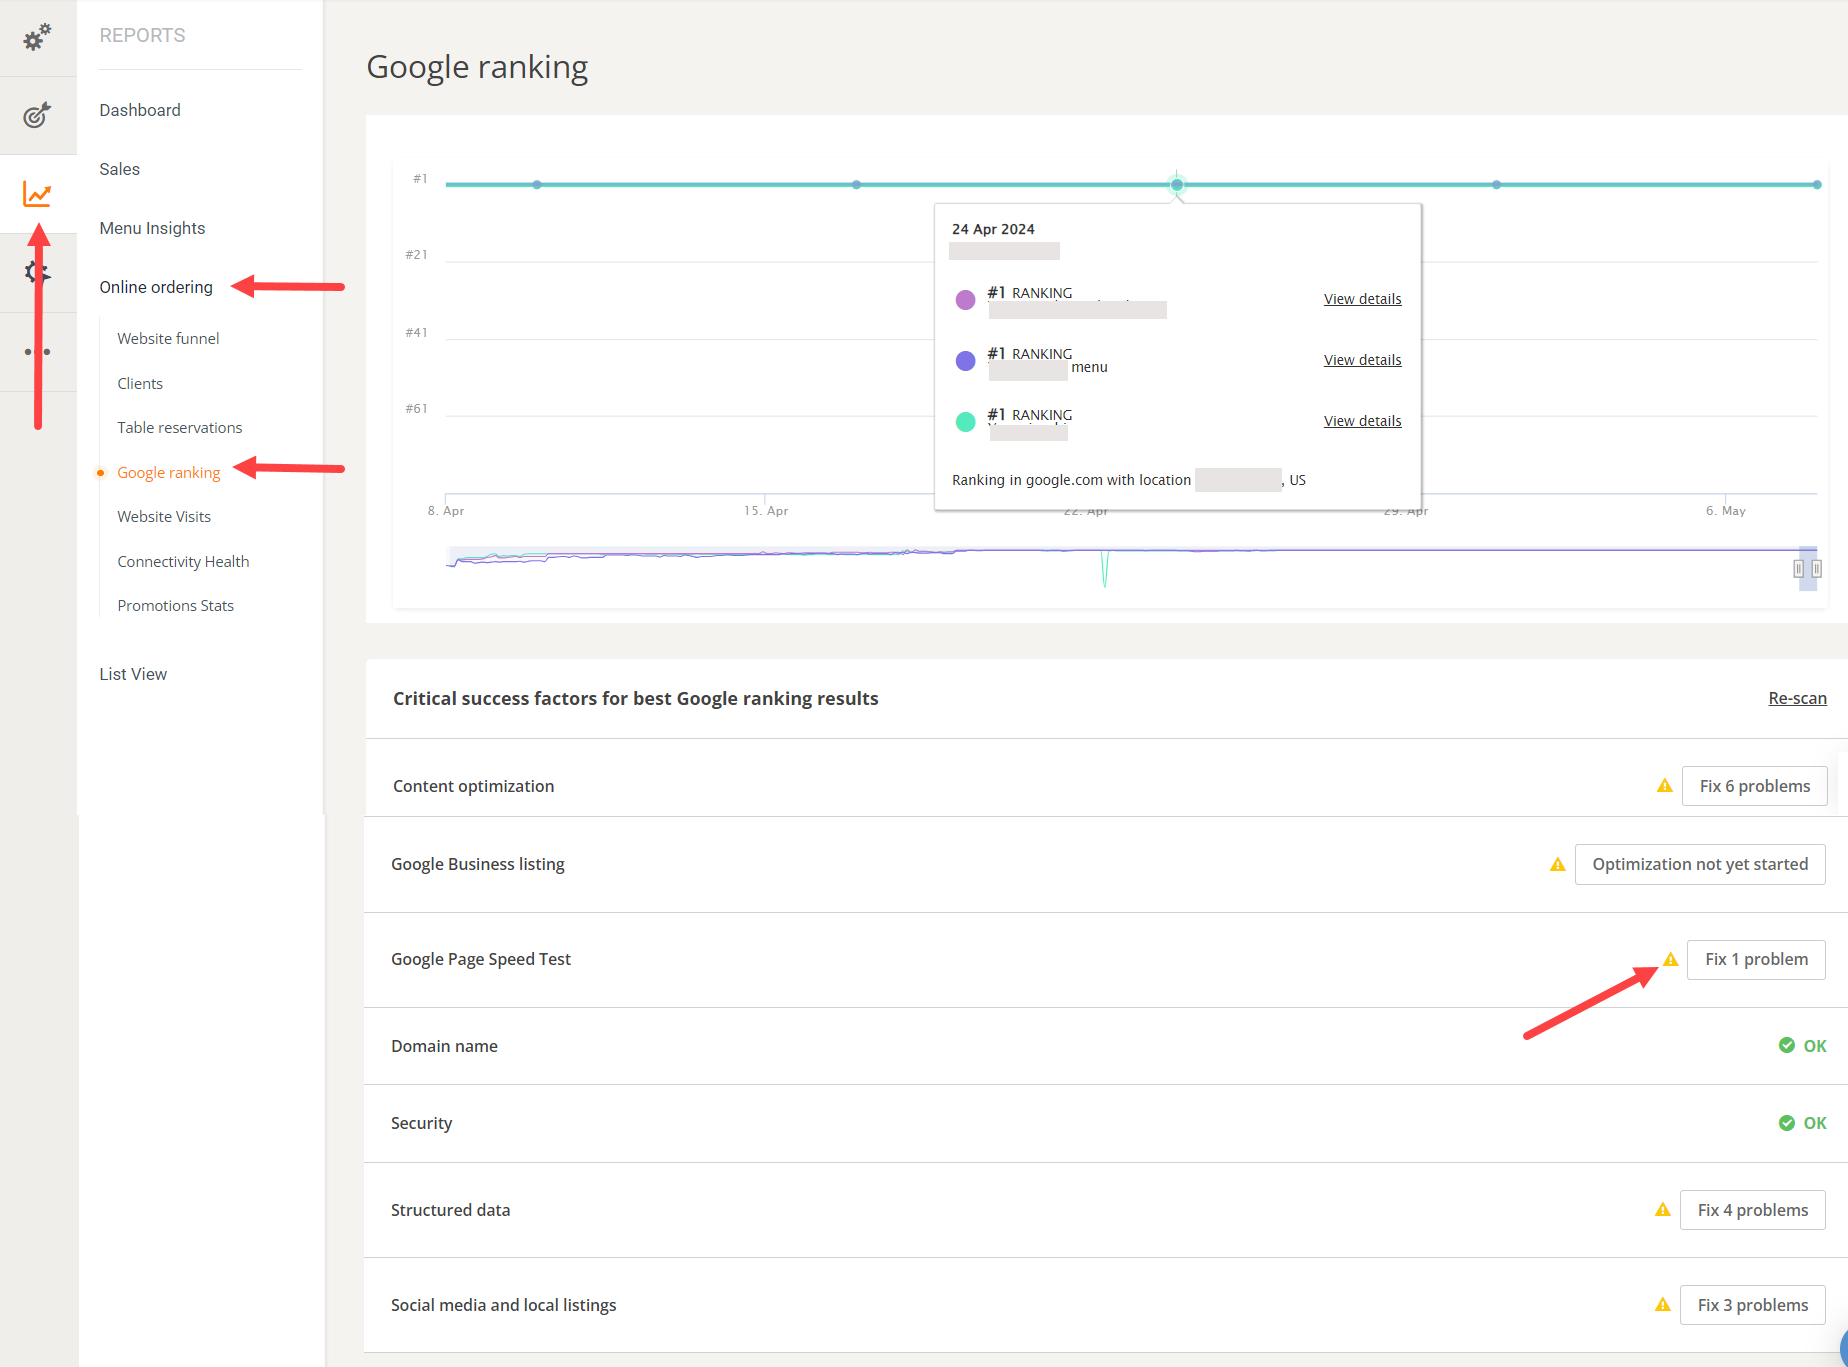
Google ranking
Implement the list of critical success factors provided to help ranking better in Google. Expand the ones that are not performing as they should, to learn how to fix the problem.
Delivery Heatmap
This report is visible to restaurants with delivery service enabled. Use it to see which delivery zones have received the most deliveries and adjust their delivery settings or promotions accordingly.
The restaurant owners can also use this section to:
- extend some delivery areas if they see a large number of orders at the outer limits of the existing ones;
- set up a free delivery promo for areas of the map with few orders;
- monitor effectiveness of sending a flyer or coupon campaign, if the owners have implemented such a marketing activity;
- appoint resources (e.g. hire more drivers) to areas where most orders are placed;
- predict which areas have the least orders and stop spending unnecessary resources to cater to those areas;
Connectivity Health
Check this report to see the connectivity health of the restaurant’s order taking app. Low connectivity may be caused by the restaurant’s staff unplugging the device from the charger, keeping the order-taking app closed, internet issues at the location etc.
If the connectivity is poor, the restaurant can miss orders.
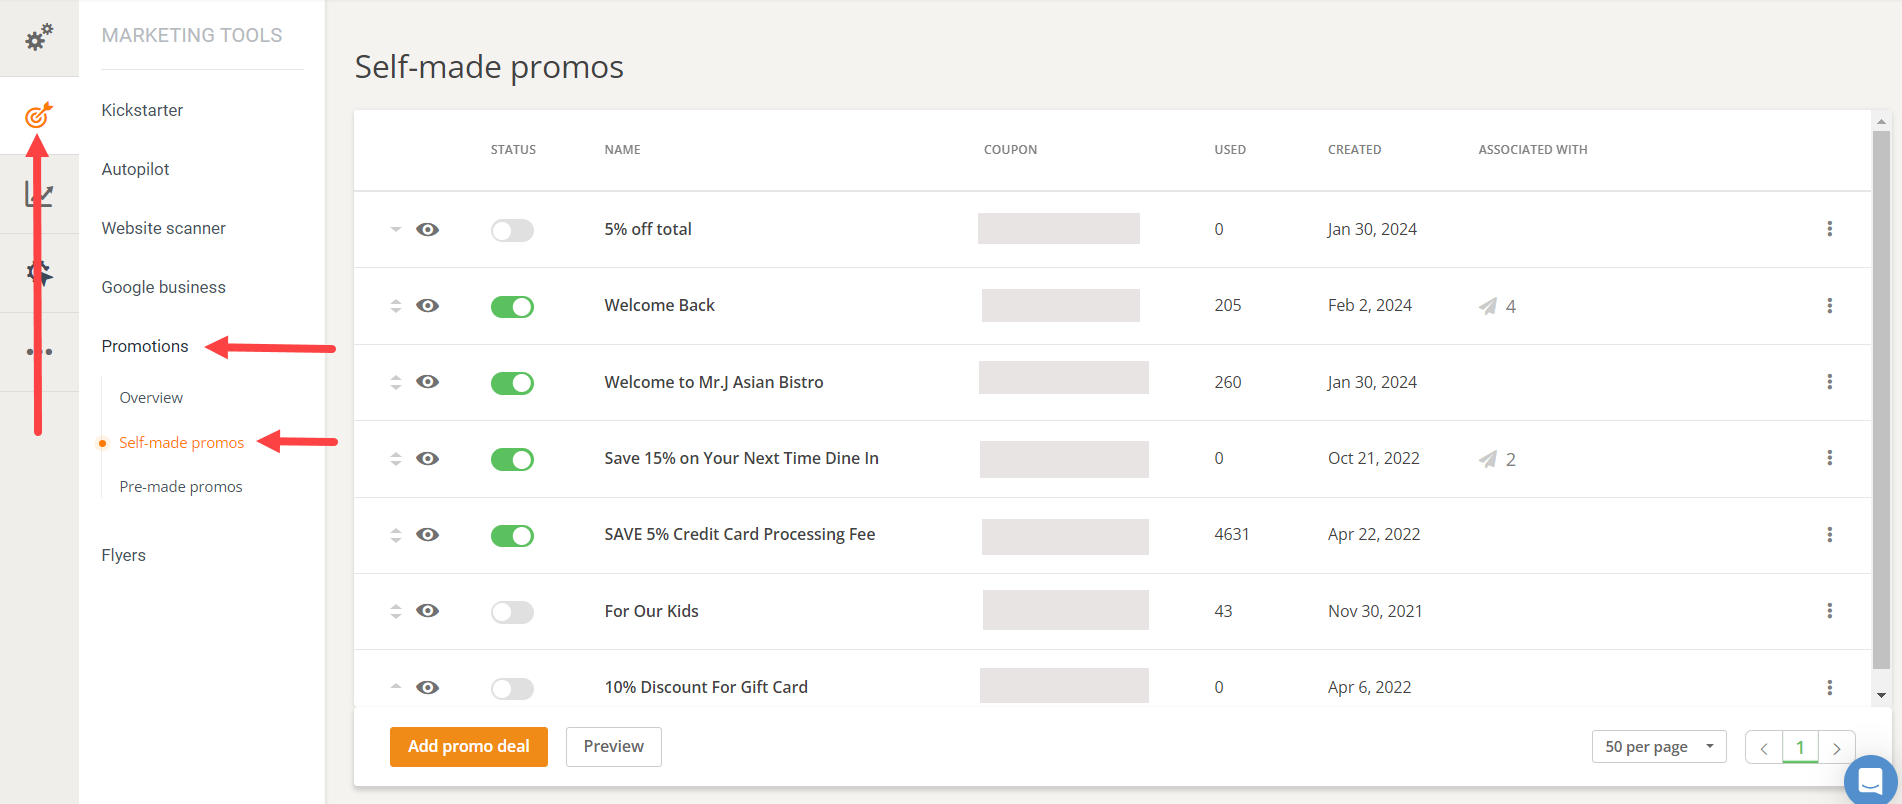
Promotion Stats
Restaurant owners use this section to monitor the performance of their promotions. They are able to view data by order value, number of orders and discount amount per time interval. This information can help restaurant owners decide to:
- discountinue promotions that do not perform well
- adjust some discounts
- set up and test new types of promotions
List view exports
This is the area of the reports section that contains the actual information on food clients and orders. Upon exporting either the clients or the orders list, the marketing consent can be added to see which of them are open to receive further communication. Restaurant owners could download the lists and use them to:
- start an email marketing campaign or an SMS marketing campaign;
- send information on menu items coming up and special events;
- distribute coupons to loyal customers;
- see the time of day when most orders were placed to adjust staff and inventory availability;
- analyze delivery addresses to see if a billboard campaign can be implemented, advertise on social media or open a new restaurant location;
***
From quickly adjusting staff levels at busy hours to developing complex marketing campaigns, restaurants owners can have many ideas to grow their sales and improve customer experience. The Reports section is a starting point for those who wish to know how they reached a certain sales level, but also for those who wish to take the necessary steps to grow.
We always recommend selecting a few ideas from the list above, working on them consistently and when the first results come in, going for the next ones that work for your restaurant.