Sales reports are vital for restaurants because they promote awareness of those locations’ overall performance. When managing a chain (multi-location), the insights a chain master gains from these reports are all the more important: these show not only the value of overall sales, but also individual trends for various services, how many clients order frequently and from which location, the average amount for an order and so on.
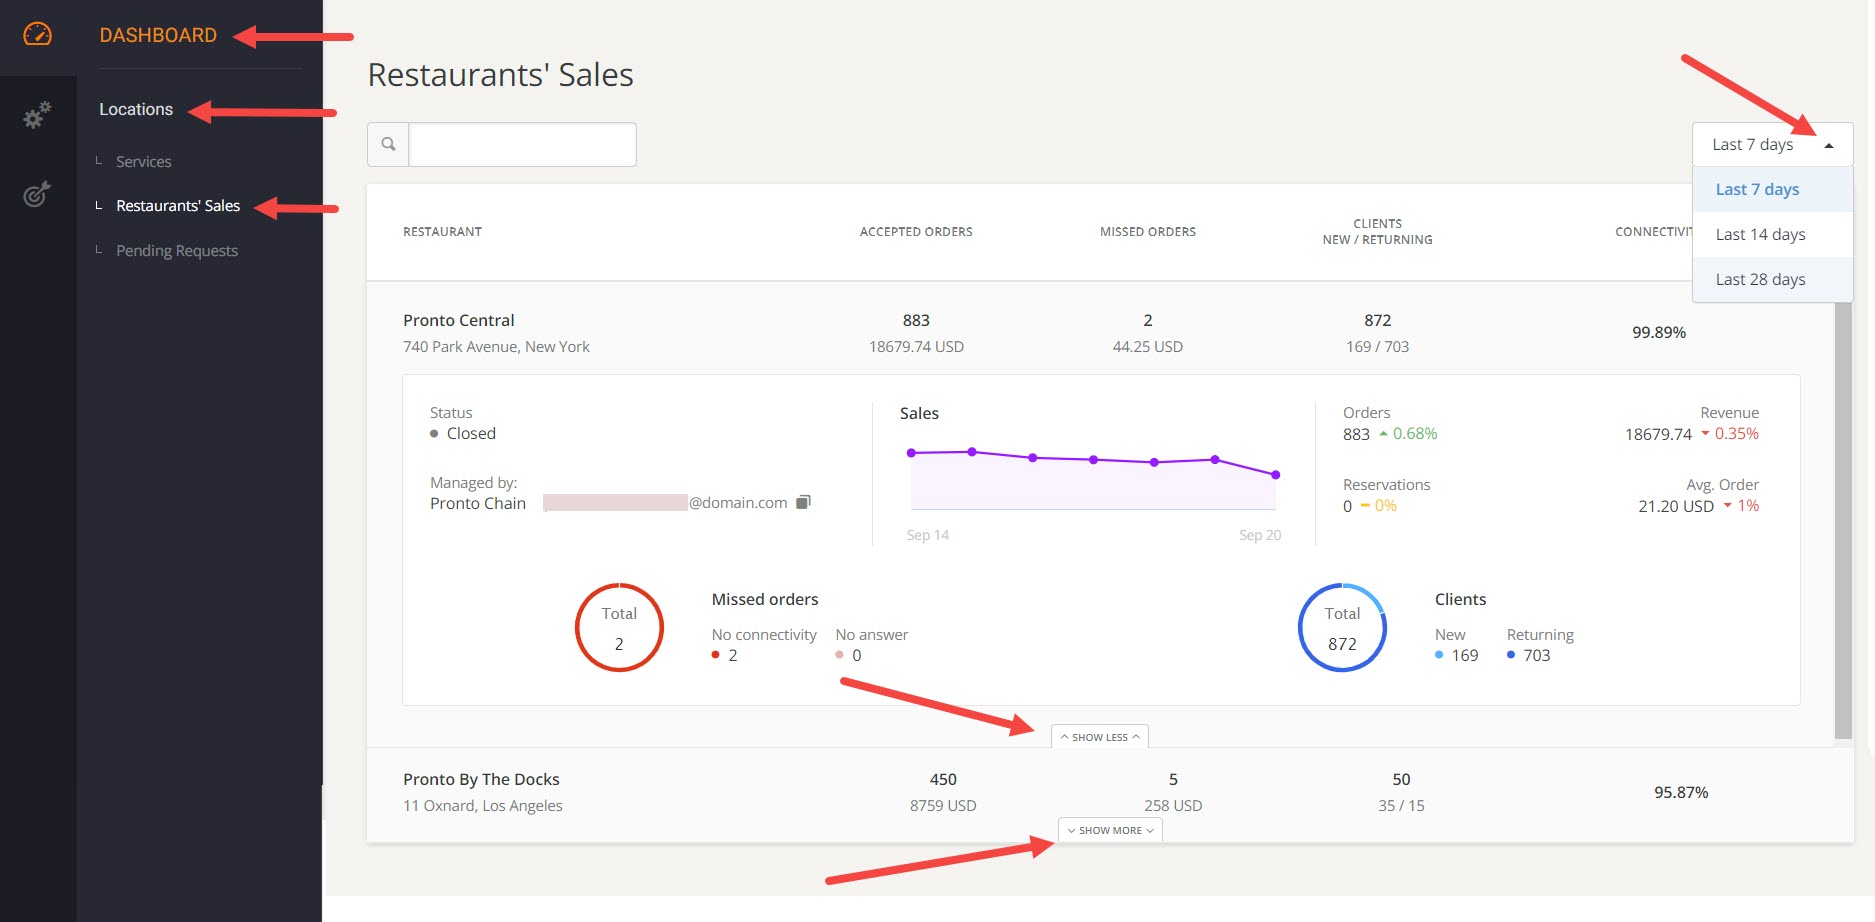
In order to be able to monitor sales trends, chain masters can access their dashboard and consult the Restaurants’ Sales section, then click Show more to expand the data view for wach location and Show less to contract it, like this:
In this section:
- Restaurant performance data can be viewed for the last 7/14/28 days;
- The total number of orders, the revenue amount, the average number of orders and table reservations can be viewed as percentage trends
- Missed orders, Sales, Clients (new and returning) are displayed also as graphs for an easy overview of these sections
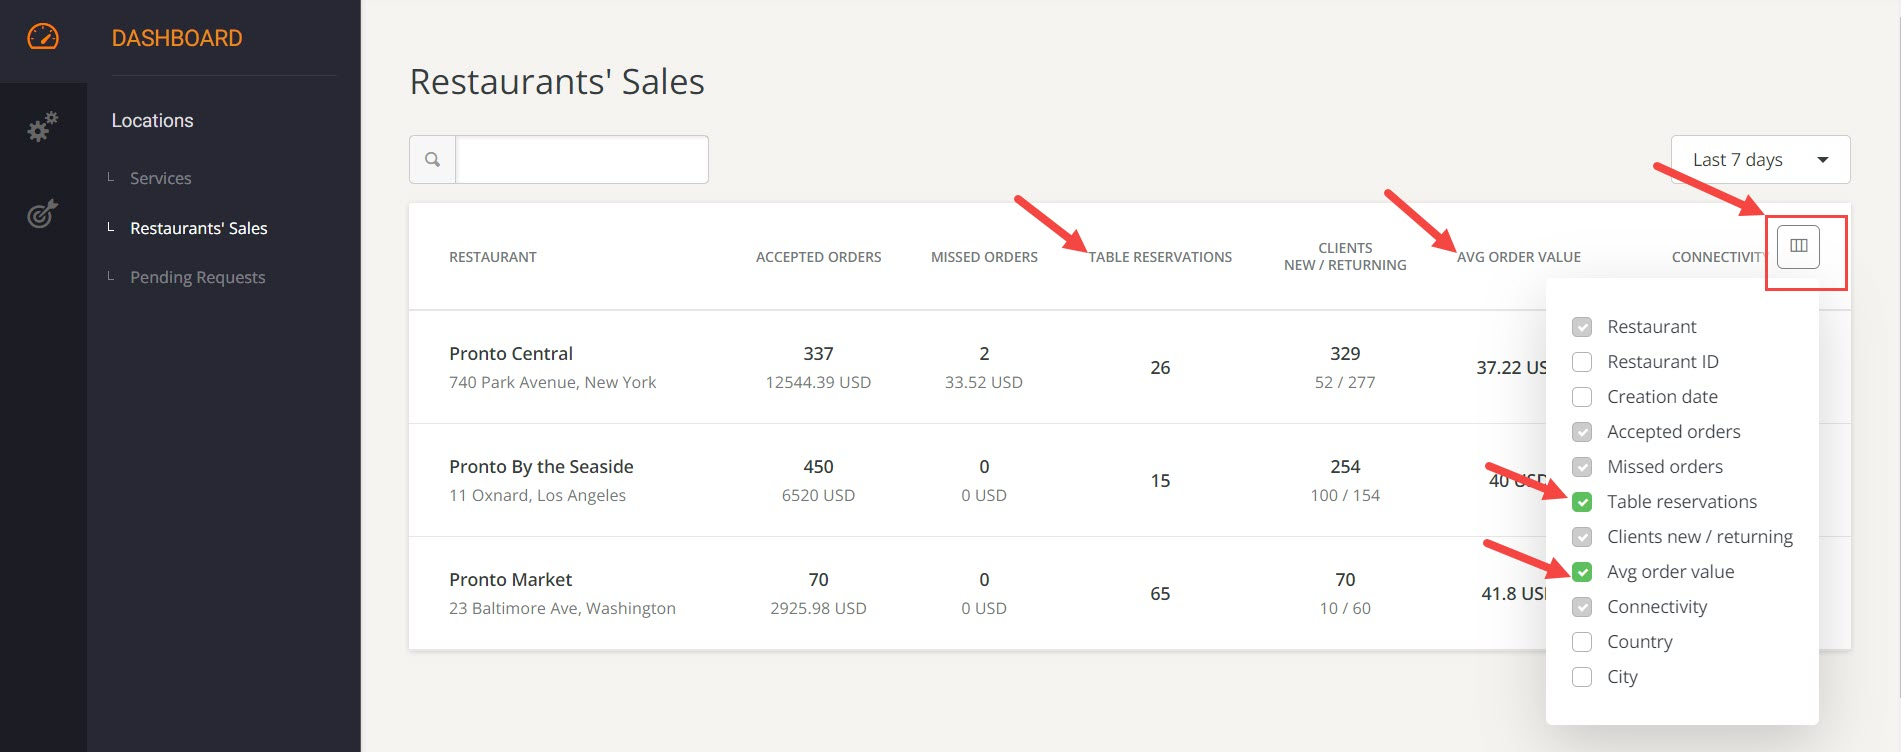
Owners of chain account can also select additional columns to view information such as: Restaurant ID, Creation date (of the location), Table reservations, Average order value, Country, City. Like this:

